Harte Gold Announces Q1 2019 Results
TORONTO, May 15, 2019 (GLOBE NEWSWIRE) -- HARTE GOLD CORP. (“Harte Gold” or the “Company”) (TSX: HRT / OTC: HRTFF / Frankfurt: H4O) is pleased to announce the following results for the first quarter (“Q1 2019”) ended March 31, 2019.
In May 2019, the Company filed a National Instrument 43-101 compliant Technical Report titled “Technical Report and Feasibility Study on the Sugar Zone Gold Operation”, effective February 14, 2019 (the “Feasibility Study Plan”). The Company’s Q1 2019 financials have been benchmarked to the Feasibility Study Plan.
Highlights
Operations
- Sugar Zone Mine produced 32,044 tonnes of ore for Q1 2019 and continued to improve over the quarter
- Produced tonnes were 10% below plan due to temporary labour, equipment and weather issues in January and February
- Mining rates are achieving plan for the month of April
- Produced tonnes were 10% below plan due to temporary labour, equipment and weather issues in January and February
- The mill processed 38,278 tonnes of ore (425 tpd average), 8% above plan
- Ore delivered to the mill was supplemented by the low grade surface stockpile
- The average head grade processed was 4.86 g/t resulting from the blended grade of mine production and the low grade surface stockpile
- Surface stockpile has been reduced from 40,000 tonnes to approximately 10,000 tonnes
- Ore delivered to the mill was supplemented by the low grade surface stockpile
- Gold production was 9% below plan, higher-grade mined ore is expected to positively impact production in the following quarters as less low grade will be blended
- Recovery was 92%, in line with plan
- 5,476 ounces of gold was produced in the first quarter of 2019
- Low grade stockpile blended with ROM ore impacted overall gold production
- Recovery was 92%, in line with plan
- Revenues for the quarter were 17% below plan as a result of lower gold production and sales due to mining equipment maintenance, shortages of mining labour and weather related issues.
- Operating costs overall were 16% higher than plan, but are expected to reduce in subsequent quarters
- Unit mining costs were 20% higher resulting from lower tonnages the first two months
- Unit processing costs were in line with targets
- Unit G&A costs were 26% higher than plan due to additional startup costs in the winter and will be reduced
- Unit mining costs were 20% higher resulting from lower tonnages the first two months
Stephen G. Roman, President and CEO of Harte Gold, commented “With our first quarter of operations completed, we are pleased to announce improving production at the Sugar Zone Mine. The quarter started with many winter challenges affecting our mining operations. We have progressed through our startup issues and operations continue to improve.”
| Operational Summary and Comparison to Feasibility Study for Q1 2019 | |||||||
| Three months ended March 31, 2019 | Feasibility Study Plan* ended March 31, 2019 | Variation | |||||
| Operating Data | |||||||
| Ore mined (tonnes) | 32,044 | 35,460 | -10% | ||||
| Ore processed (tonnes) | 38,278 | 35,460 | 8% | ||||
| Average daily throughput (tpd) | 425 | 394 | 8% | ||||
| Head grade (g/t) | 4.86 | 5.91 | -18% | ||||
| Recovery (%) | 92% | 92% | 0% | ||||
| Gold ounces produced | 5,476 | 6,011 | -9% | ||||
| Gold ounces sold | 4,695 | 6,011 | -22% | ||||
| Financial Data (000 $) | |||||||
| Revenues | 7,859 | 9,473 | -17% | ||||
| Mining cost | 4,459 | 4,105 | 9% | ||||
| Processing cost | 2,686 | 2,485 | 8% | ||||
| Site G&A | 3,473 | 2,563 | 36% | ||||
| Inventory changes | 277 | - | - | ||||
| Operating income (loss) | (2,482) | 320 | - | ||||
| Unit Input Costs (in dollars) | |||||||
| Mining cost (per tonne ROM) | 139 | 116 | 20% | ||||
| Processing cost (per tonne) | 70 | 70 | 0% | ||||
| Site G&A (per tonne) | 91 | 72 | 26% | ||||
Corporate
- The Company received operational permits to increase throughput to 800 tonnes per day (tpd)
- A US$82.5 million financing package announced on May 6, 2019 and comprised of:
- US$52.5 million 6-year Term Loan provided by BNP Paribas (“BNP”)
- US$20.0 million 3-year Revolving Credit Facility provided by BNP
- US$10.0 million equity investment provided by Appian Natural Resources Fund (“Appian”)
- US$52.5 million 6-year Term Loan provided by BNP Paribas (“BNP”)
- Benefits of the refinancing include:
- Removes balance sheet overhang and refinancing risk allowing the Company to focus on increasing production to 800 tpd and continued resource expansion
- Low interest rate: LIBOR plus 2.875% to 3.875% based on credit ratios
- Partnership with a leading Global Financial Institution
- Term loan with flexible repayment schedule
- Continued validation and support from the Company’s largest shareholder, Appian
- Removes balance sheet overhang and refinancing risk allowing the Company to focus on increasing production to 800 tpd and continued resource expansion
Outlook
The following outlook is based on the Feasibility Study Plan, adjusted for Q1 2019 actual results.
- Operations are on track for Q2 to Q4 2019
- Full year 2019, the Company expects to produce 39,200 ounces of gold
- Operating costs over this period are expected to be $200 per tonne, implying a cash cost of $1,050 to $1,100 per ounce (US$800 to US$850 per ounce)
- All in sustaining cost of $1,700 to $1,775 per ounce (US$1,300 to US$1,350 per ounce)
- Achieving 800 tpd, currently targeted for Q4 2019 per the Feasibility Study Plan, will result in decreased operating and AISC costs
- With the increase in production rates, 2020 Feasibility Study cash costs are expected to be US$615 per ounce (AISC of US$913 per ounce) and life of mine cash costs are expected to be US$643 per ounce (AISC of $845 per ounce)
| Quarterly Production Outlook – 2019 | ||||||||||
| Actual | Feasibility Study Plan | Full Year* | ||||||||
| Q1 2019 | Q2 2019 | Q3 2019 | Q4 2019 | 2019 | ||||||
| Production | ||||||||||
| Throughput (tpd) | 425 | 532 | 646 | 722 | 581 | |||||
| Ore Tonnage (tonnes) | 38,278 | 47,900 | 58,100 | 65,000 | 209,200 | |||||
| Head Grade (g/t) | 4.86 | 6.75 | 5.96 | 6.71 | 6.18 | |||||
| Mill Recovery | 91.6% | 94.0% | 95.5% | 95.5% | 94.3% | |||||
| Gold Production (oz) | 5,476 | 9,800 | 10,600 | 13,400 | 39,200 | |||||
| Unit Input Costs (in Cdn dollars) | ||||||||||
| Mining cost (per tonne ROM) | 139 | 97 | 99 | 100 | 105 | |||||
| Processing (per tonne milled) | 70 | 46 | 37 | 36 | 45 | |||||
| Site G&A (per tonne milled) | 91 | 52 | 41 | 36 | 50 | |||||
| * Numbers may not add due to rounding | ||||||||||
Value Opportunities For 2019
The following are some of the value opportunities management is pursuing to improve mine plan economics currently not captured in the Feasibility Study Plan:
- Cost optimizations related to contractor costs and site maintenance
- Accelerate the ramp-up to achieve 800 tpd ahead of Q4 2019
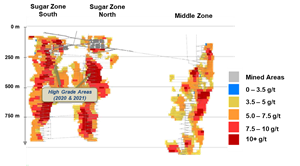
- Explore opportunities to access higher grade areas of the mine plan currently not in the 2019 plan (see illustration below)
Feasibility Study Mine Plan: http://www.globenewswire.com/NewsRoom/AttachmentNg/4c7024ba-5746-4044-b76a-cee30c3f8ccd
Operating Activities
Mining
- In the months of January and February, start-up challenges included contractor equipment breakdowns, lack of manpower, reduced power voltage, power outages and weather related road closures
- During March, ore supply consistently improved as the following was completed:
- Underground equipment availability issues were addressed
- Continued focus on recruitment of skilled mine workers
- The underground electrical system was upgraded resulting in waste and sill development targets being achieved
- Ore supply from stopes is now on track as more stopes are brought on line
- Underground equipment availability issues were addressed
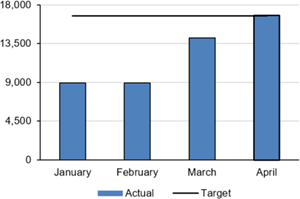
- The Feasibility Study plan was achieved for the month of April with underground mining achieving an average daily tonnage of approximately 540 tpd
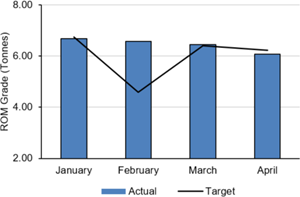
- Mined grade is consistent with plan
- Stope blasting has gone smoothly, resulting in minimal overbreak or unplanned dilution
Mined Ore Tonnage – Actual vs. Target (540 tpd): http://www.globenewswire.com/NewsRoom/AttachmentNg/0f833835-2a99-4f8e-b89c-edb5727aee94
Diluted Mined Grade – Actual vs. Target: http://www.globenewswire.com/NewsRoom/AttachmentNg/c6296aa3-8e3e-46c3-935d-f3318ae25d98
Processing
- The mill and tailings management facility are operating to plan
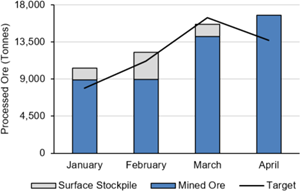
- Mill throughput exceeded plan as surface stockpiles offset lower mine production in January and February
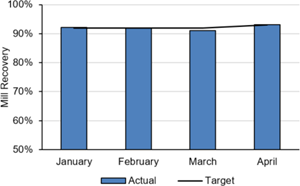
- Overall mill recovery was consistent with plan averaging 91% over the first quarter
- Recovery from the gravity circuit was 38% and flotation recovery was 53%
- Gravity recovery is expected to increase with higher grade ore deliveries
- Recovery from the gravity circuit was 38% and flotation recovery was 53%
Processed Ore Tonnage – Actual vs. Target: http://www.globenewswire.com/NewsRoom/AttachmentNg/45a76609-51c7-44aa-924e-7dcf582ba7ac
Overall Mill Recovery – Actual vs. Target: http://www.globenewswire.com/NewsRoom/AttachmentNg/bdd419c8-efc3-4713-b480-ff1e9819793a
Liquidity and Capital Resources
Excluding debt, the Company had a working capital deficit of $14,109,039 at March 31, 2019 compared to a deficit of $10,895,611 at December 31, 2018. In view of its discussions with various lenders about an overall refinancing, the Company had elected not to drawdown further on its Sprott loan facility. At March 31, 2019, US $40 million of the US $50 million Sprott loan facility had been drawn.
On May 6, 2019, the Company announced a US$82.5 million refinancing package, comprising US$10.0 million investment in special shares of the Company by Appian and a US $72.5 million senior debt facility provided by BNP Paribas (“BNP”). Proceeds will be used to repay the existing Appian and Sprott loans as well as for general corporate purposes.
The Appian special share investment is convertible to common shares at a price of C$0.27 per share upon receipt of shareholder approval to enable Appian to increase its ownership of the Company above 20%. Such approval is expected to be obtained at the Company’s annual general meeting in June. Additionally, Appian provided a non-equity stand-by facility of US $7.5 million available at Harte’s option for a period of 12 months and agreed to extend the maturity of its existing debt facility until closing of the BNP loans. The Company has agreed to issue Appian 5 million warrants to purchase common shares at Cdn $0.27 per share for a 5 year period, as compensation for the loan extension and stand-by commitments.
The BNP debt facility comprises a term loan of US $52.5 million and a revolving credit facility of US $20.0 million. Interest on the BNP debt is LIBOR plus 2.875% to 3.875% dependent on credit ratios. Principal repayments under the term loan begin on March 31, 2020 repayable quarterly over 22 quarters through June 30, 2025. The BNP debt facility will replace the Appian and Sprott loans and will be secured by all the assets of the Company.
The refinancing is expected to be completed in Q2 2019, improving the liquidity position of the Company and significantly reducing the debt servicing costs.
Qualified Persons and NI 43-101 Disclosure
The company has implemented a quality assurance and control (“QA/QC”) program to ensure sampling and analysis of mine and exploration work is conducted in accordance with industry standards. Drill core is sawn in half with one half of the core shipped to Activation Laboratories located in Thunder Bay, ON, while the other half is retained at the Company’s core facilities in White River, ON, for future verification. Channel and Chip samples were sent to Wesdome Mines lab in Wawa, ON. Certified reference standards and blanks are inserted into the sample stream on a regular interval basis and monitored as part of the QA/QC program. Gold analysis is performed by fire assay using atomic absorption, gravimetric or pulp metallic finish.
Robert Kusins, P. Geo., Harte Gold’s Senior Mineral Resource geologist, is the Company’s Qualified Person and has prepared, supervised the preparation, or approved the scientific and technical disclosure in this news release.
About Harte Gold Corp.
Harte Gold is Ontario’s newest gold producer through its wholly owned Sugar Zone Mine in White River Ontario. Using a 3 g/t gold cut-off, the NI 43-101 compliant Mineral Resource Estimate dated February 19, 2019 contains an Indicated Mineral Resource of 4,243,000 tonnes grading 8.12 g/t Au with 1,108,000 ounces contained gold and an Inferred Mineral Resource of 2,954,000 tonnes, grading 5.88 g/t Au with 558,000 ounces contained gold. Exploration continues on the Sugar Zone Property, which encompasses 79,335 hectares covering a significant greenstone belt.
| For further information, please contact: Stephen G. Roman President and CEO Tel: 416-368-0999 Email: sgr@hartegold.com | Shawn Howarth Vice President, Corporate Development Tel: 416-368-0999 E-mail: sh@hartegold.com |
This news release includes "forward-looking statements", within the meaning of applicable securities legislation, which are based on the opinions and estimates of Management and are subject to a variety of risks and uncertainties and other factors that could cause actual events or results to differ materially from those projected in the forward-looking statements. Forward-looking statements are often, but not always, identified by the use of words such as "seek", "anticipate", "budget", "plan", "continue", "estimate", "expect", "forecast", "may", "will", "project", "predict", "potential", "targeting", "intend", "could", "might", "should", "believe" and similar words suggesting future outcomes or statements regarding an outlook. Such risks and uncertainties include, but are not limited to, risks associated with the mining industry, including operational risks in exploration, development and production; delays or changes in plans with respect to exploration or development projects or capital expenditures; the uncertainty of reserve estimates; the uncertainty of estimates and projections in relation to production, costs and expenses; the uncertainty surrounding the ability of the Company to obtain all permits, consents or authorizations required for its operations and activities; and health, safety and environmental risks, the risk of commodity price and foreign exchange rate fluctuations, the ability of Harte Gold to fund the capital and operating expenses necessary to achieve the business objectives of Harte Gold, the uncertainty associated with commercial negotiations and negotiating with foreign governments and risks associated with international business activities, as well as those risks described in public disclosure documents filed by the Company. Due to the risks, uncertainties and assumptions inherent in forward-looking statements, prospective investors in securities of the Company should not place undue reliance on these forward-looking statements. Statements in relation to "reserves" or “resources” are deemed to be forward-looking statements, as they involve the implied assessment, based on certain estimates and assumptions, that the reserves or resources described may be profitably produced in the future.
Readers are cautioned that the foregoing list of risks, uncertainties and other factors are not exhaustive. The forward-looking statements contained in this document are made as of the date hereof and the Company undertakes no obligation to update publicly or revise any forward-looking statements or in any other documents filed with Canadian securities regulatory authorities, whether as a result of new information, future events or otherwise, except in accordance with applicable securities laws. The forward-looking statements are expressly qualified by this cautionary statement.
The Toronto Stock Exchange has not reviewed and does not accept responsibility for the adequacy or accuracy of this release.

