Lithological and Drill Chip Pile Sampling Confirms Anomalous Copper - Molybdenum Values at the Avispa Property in northern Chile
TORONTO, Aug. 23, 2022 (GLOBE NEWSWIRE) -- Montero Mining and Exploration Ltd. (TSX-V: MON) (“Montero” or the “Corporation”) is reporting the assay results of surface geochemical sampling undertaken within areas of interest on the Avispa property (“Avispa “or “Project”). Company geologists collected lithological samples from the San Salvador River valley and from reverse circulation (RC) drill chip piles from drilling sites completed by BHP and Quantum Pacific Exploration Chile (“Quantum”) on the Avispa property. Some samples returned anomalous copper and molybdenum values which require further investigation and supports Montero’s belief the Avispa project area has been only cursorily explored for potential concealed copper molybdenum porphyry deposits beneath surficial sediments and gravels.
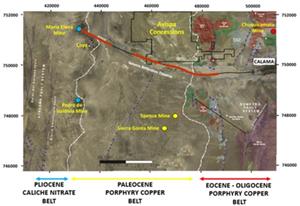
Avispa is located about 40 km to the west of the supergiant Chuquicamata copper porphyry deposit in an area currently being explored by major mining companies. It is situated within the defined north-south trending Palaeocene–Eocene Cu-Mo porphyry belt and 40 km north of BHP’s Spence Cu-Mo mine and KGHM/South32’s Sierra Gorda Cu-Mo mine. Avispa is 20 km east of the extensive north-south trending Caliche Nitrate belt hosting the nearby Maria Elena and Pedro de Valdivia Nitrate-Iodine mines operated by SQM (Figure 1). Avispa project has an extensive cover of sedimentary and evaporite salt deposits underlain by gravel deposits of Miocene age. These sediments overlay and partially cover Cretaceous volcanics and sediments which are intruded by the target Palaeocene monzodiorite and diorite porphyries and Cretaceous andesitic and diorite porphyries that potentially host copper porphyry mineralization.
Dr. Tony Harwood, President and Chief Executive Officer of Montero commented: “Montero is pleased to report that the strategy of increasing our land position has paid off with the results of mapping showing altered intrusive outcrop on the property. Geochemical sampling of these lithologies and samples taken from RC drill chip piles left by previous operators yielded exciting copper and molybdenum anomalies on the property. Copper anomalies of > 100 ppm Cu and between 10-25 ppm Mo were returned from the program. The Company is further evaluating the geochemical results and has engaged a consulting company to undertake propriety algorithmic geochemical analysis of the results with a goal of generating 3-D targets indicating the location of possible copper molybdenum porphyry mineralization.” Avispa is also assessing for its lithium, iodine, and nitrate mineral potential.”
Figure 1: Satellite image of the northern Atacama/Antofagasta region showing the Avispa property relative to major copper molybdenum porphyry mines and Caliche nitrate-iodine mines (amended after Lopez et al, 2019) is available at https://www.globenewswire.com/NewsRoom/AttachmentNg/91dc4b8a-0062-4417-85e4-8d9952fcd869.
The extensive Quaternary and Miocene sedimentary cover at Avispa only allows for geochemistry, structural mapping, remote sensing techniques or, more costly geophysical surveys and drilling to help target Cu-Mo porphyry mineralization in the underlying Cretaceous rocks.
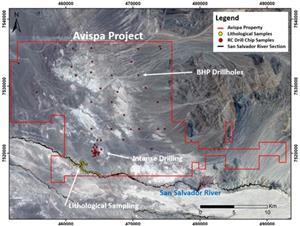
The San Salvador River valley located along the southern boundary of the property provides a window into the Cretaceous geology below the Quaternary and Miocene rocks. The river valley is some 120-160 m below the Miocene plateau and exposes the underlying Cretaceous volcanics and sediments as well as providing information on the thickness of the Miocene sedimentary overburden. Montero conducted detailed mapping and of these rocks along this valley and its tributaries. (Figure 2). A total of 37 grab samples of rock types exposed along a transect were sampled and subjected to 4 acid digest and 48 element ICP-MS assays. Individual analysis, location and sample description for the lithological samples are shown in Table 1.
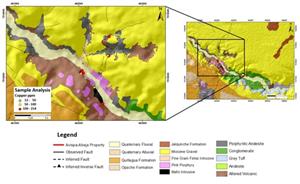
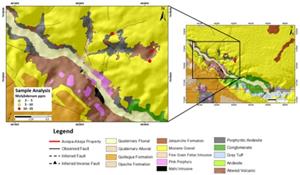
The results for copper and molybdenum analyses in the San Salvador lithological samples are provided in Figures 3 and 4, respectively. Copper was anomalous in 7 locations returning values of >100 ppm Cu with the highest value of 476 ppm Cu coming from sample of Cretaceous andesite volcanic rock (Figure 3). Molybdenum showed anomalous values of > 5 ppm Mo and in 3 locations highly anomalous values of >10-25 ppm Mo were obtained (Figure 4). The latter values were obtained from altered Cretaceous andesite volcanic rock.
Figure 2: Satellite image with location of Montero’s lithological sampling sites (yellow circles) and RC drill chip pile sampling sites (red circles) is available at https://www.globenewswire.com/NewsRoom/AttachmentNg/2bfde3fd-d083-430d-8385-29bf5dbcfb62. BHP drilled widely spaced RC holes while Quantum completed intense drilling.
Figure 3: Geological map of copper (Cu) assay results for lithological grab samples collected along the San Salvador River section is available at https://www.globenewswire.com/NewsRoom/AttachmentNg/15a5dd2c-7616-4860-9b84-99b24e51b2de. Seven samples returned >100 ppm Cu (red dots) with the highest assay of 476 ppm Cu.
Figure 4: Geological map of the San Salvador valley showing molybdenum assay results of lithological samples collected is available at https://www.globenewswire.com/NewsRoom/AttachmentNg/9f30c2d4-5f8f-4ecb-b050-5263efd81428. Anomalous values of 10-25 ppm Mo were obtained from altered andesite volcanics.
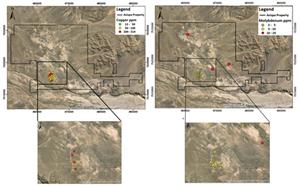
The Company completed sampling of rock chips piles from previous RC drilling site at Avispa (Figure 2). The origin of the RC drill chips piles is unknown and it assumed they are mixed and originated from an unknown depth at each drill site. A total of 48 grab samples from drill chip piles were submitted for 48-element analysis by 4 acid digestion followed by ICP-MS analysis. The results for copper and molybdenum analysis are provided in Figures 5. The highest copper concentrations of >100 ppm Cu were obtained from the area of intense drilling. In contrast the highest molybdenum anomalies of 10-25 ppm Mo were collected from 3 BHP RC drill hole sites. Individual analysis for the drill chip samples are shown in Table 1.
The lithological sampling in the San Salvador area and the drill chip sampling confirmed the occurrence of altered, intrusive rock as part of the underlying geology, from which several grab samples returned anomalous copper and highly anomalous molybdenum concentrations. For reference, exploration geochemical results during the exploration of BHP’s Spence deposit south of Avispa reported anomalies up to 100 ppm Cu and 5 ppm Mo (Cameron and others 2004, 2009) in surface gravels. Similarly, EMSA/Codelco reported anomalies of up to 43 ppm Cu and 7 ppm Mo in gravels at their Pampa las Torres property east of the Chug Chug prospect. (Expatriate Resources, 2001).
Figure 5: Satellite image showing the location of RC drill chip sampling sites with Cu results in Cu ppm (left image) and Mo results in Mo ppm (right image) is available at https://www.globenewswire.com/NewsRoom/AttachmentNg/26af788c-ecbb-4f23-ad12-1155ce17fb51.
Table 1: Location, lithology and results for Cu, Mo, Pb and Zn analysis by 4 acid digestion ICP-MS of samples obtained from lithological grab samples from the San Salvador River valley and surrounds.
| Sample ID | Rock Type | Cu ppm | Mo ppm | Pb ppm | Zn ppm | Sample ID | Rock Type | Cu ppm | Mo ppm | Pb ppm | Zn ppm |
| 612060 | Tuff | 78 | 2 | 9 | 79 | 612141 | Andesite | 37 | 4 | 11 | 46 |
| 612061 | Tuff | 50 | <2 | 2 | 68 | 612142 | Andesite | 74 | 9 | 58 | 261 |
| 612062 | Tuff | 61 | <2 | 8 | 72 | 612143 | Altered volcanic | 58 | 12 | 623 | 340 |
| 612063 | Tuff | 49 | <2 | 2 | 47 | 612144 | Altered volcanic | 41 | 13 | 193 | 24 |
| 612064 | Andesite | 35 | 3 | 9 | 53 | 612145 | Volcanic? | 99 | 2 | 3 | 59 |
| 612065 | Andesite | 57 | <2 | 4 | 81 | 612146 | Intrusive | 27 | 11 | 47 | 605 |
| 612066 | Intrusive | 36 | 6 | 62 | 55 | 612147 | Andesite faulted | 112 | 4 | 42 | 231 |
| 612067 | Intrusive | 63 | 4 | 14 | 85 | 612148 | Altered volcanic | 76 | 3 | 7 | 100 |
| 612068 | Intrusive | 107 | <2 | 12 | 80 | 612149 | Igneous Breccia | 68 | 4 | 7 | 53 |
| 612069 | Volcanic | 32 | 3 | 5 | 13 | 612150 | White carbonate | 15 | <2 | 6 | 33 |
| 612070 | Conglomerate | 99 | <2 | <2 | 64 | 612151 | Altered volcanic | 29 | 7 | 12 | 36 |
| 612071 | Conglomerate | 476 | <2 | 6 | 69 | 612152 | Intrusive | 119 | <2 | 8 | 62 |
| 612072 | Conglomerate | 121 | <2 | 8 | 73 | 612153 | Intrusive | 117 | <2 | <2 | 35 |
| 612073 | Gravel | 45 | 2 | 11 | 35 | 612280 | Andesite | 68 | 9 | 7 | 51 |
| 612074 | Conglomerate | 54 | <2 | 3 | 71 | 612281 | Altered volcanic | 59 | 6 | 8 | 84 |
| 612075 | Conglomerate | 89 | <2 | 4 | 76 | 612282 | Andesite | 93 | <2 | 7 | 63 |
| 612136 | Intrusive | 40 | 4 | 14 | 109 | 612283 | Altered volcanic | 76 | 8 | 10 | 58 |
| 612137 | Intrusive | 68 | 3 | 3 | 77 | 612284 | Andesite | 53 | <2 | 5 | 118 |
| 612138 | Andesite | 46 | <2 | 6 | 15 | 612285 | Andesite | 28 | <2 | <2 | 93 |
| 612139 | Intrusive | 66 | <2 | 5 | 42 | 612286 | Intrusive | 34 | 3 | 13 | 55 |
| 612140 | Intrusive | 143 | 2 | 13 | 118 | 612287 | Intrusive | 56 | 3 | 25 | 58 |
Table 2: Location, lithology and results for Cu, Mo, Pb and Zn analysis by 4 acid digestion ICP-MS of samples obtained from previous drill holes sites.
| Sample ID | Rock Type | Cu ppm | Mo ppm | Pb ppm | Zn ppm | Sample ID | Rock Type | Cu ppm | Mo ppm | Pb ppm | Zn ppm |
| 506504 | Volcanic | 44 | 4 | 13 | 58 | 506528 | Gravel | 38 | 5 | 17 | 58 |
| 506505 | Andesite | 31 | 3 | 13 | 63 | 506529 | Gravel | 37 | 25 | 14 | 92 |
| 506506 | Andesite | 30 | 6 | 14 | 63 | 506530 | Gravel | 32 | 5 | 12 | 70 |
| 506507 | Andesite | 40 | 3 | 14 | 80 | 506531 | Andesite/Intrusive | 84 | 5 | 7 | 82 |
| 506508 | Andesite | 33 | 9 | 14 | 71 | 506532 | Andesite/Tuff | 68 | 3 | 13 | 70 |
| 506509 | Andesite/Intrusive | 16 | 5 | 21 | 75 | 506533 | Andesite | 99 | 7 | 13 | 76 |
| 506510 | Dacite | 22 | 6 | 12 | 49 | 506534 | Andesite | 137 | 4 | 12 | 76 |
| 506511 | Gravel | 32 | 2 | 16 | 75 | 506535 | Andesite | 84 | 9 | 17 | 99 |
| 506512 | Gravel | 41 | 8 | 22 | 89 | 506536 | Andesite | 58 | 2 | 16 | 105 |
| 506513 | Gravel | 33 | 11 | 18 | 79 | 506537 | Andesite/Intrusive | 60 | 9 | 11 | 76 |
| 506514 | Gravel/Andesite | 21 | 2 | 8 | 57 | 506538 | Andesite | 93 | 5 | 14 | 82 |
| 506515 | Gravel | 12 | 7 | 12 | 53 | 506539 | Andesite/Intrusive | 84 | 6 | 14 | 74 |
| 506516 | Gravel | 38 | 4 | 37 | 122 | 506540 | Andesite/Intrusive | 80 | 3 | 9 | 83 |
| 506517 | Andesite/Intrusive | 34 | 9 | 12 | 70 | 506541 | Andesite/Intrusive | 56 | 8 | 12 | 58 |
| 506518 | Andesite | 18 | 4 | 19 | 95 | 506542 | Gravel/Andesite | 64 | 3 | 11 | 66 |
| 506519 | Andesite | 55 | 3 | 8 | 81 | 506543 | Andesite | 73 | 7 | 7 | 80 |
| 506520 | Gravel | 34 | 8 | 18 | 80 | 506544 | Andesite/Intrusive | 137 | 5 | 12 | 71 |
| 506521 | Gravel | 37 | 6 | 17 | 86 | 506545 | Gravel/Andesite | 64 | 6 | 11 | 78 |
| 506522 | Gravel | 43 | 9 | 23 | 110 | 506546 | Gravel/Andesite | 59 | 2 | 8 | 69 |
| 506523 | Andesite | 25 | 5 | 13 | 83 | 506547 | Gravel | 60 | 4 | 9 | 79 |
| 506524 | Gravel/Andesite | 45 | 4 | 10 | 67 | 506548 | Intrusive | 102 | 9 | 13 | 70 |
| 506525 | Gravel | 29 | 14 | 13 | 66 | 506549 | Gravel | 214 | 5 | 47 | 126 |
| 506526 | Gravel | 25 | 5 | 13 | 48 | 506550 | Gravel/Andesite | 55 | 7 | 12 | 83 |
| 506527 | Gravel | 41 | 5 | 14 | 103 | 506551 | Gravel | 30 | 6 | 12 | 70 |
To assist the Company in defining potential porphyry drill targets, management has engaged Fathom Geophysics to evaluate all current project data with the objective of identifying potential vectors to buried porphyry-type Cu-Mo deposits. The results of this work are expected in Quarter 3 2022 and will be integrated into the targeting program for an eventual initial drilling program at Avispa.
Montero has also undertaken initial geological mapping and sampling to evaluate Avispa’s potential to host lithium, iodine, and nitrate (fertilizer) mineralization. The target lithologies are Quaternary to Miocene in age and consist of lacustrine sediments and evaporite deposits that have previous reported anomalous values of these elements and minerals (PR February 26, 2019). The Company has conducted remote sense data interpretation and field mapping can confirm that these lithologies are exposed over an area of more than 100 km2 at Avispa. The Company has outlined 44 locations on the and complete a detailed mapping and sampling and the results of this work are expected in Quarter 3, 2022.
Qualified Person's Statement
This press release was reviewed and approved by Mr. Mike Evans, M.Sc. Pr.Sci.Nat. and Sr. Marcial Vergara B.Sc. Geology who are qualified persons for the purpose of National Instrument 43-101. Sr Vergara is based in Santiago and has more than 30 years’ experience in copper exploration experience in Chile.
About Montero
Montero is a junior exploration company focused on finding, exploring, and advancing globally significant gold, silver, and base metal deposits in Chile. Montero’s board of directors and management have an impressive track record of successfully discovering and advancing precious metal and copper projects. Montero trades on the TSX Venture Exchange under the symbol MON and has 38,647,485 shares outstanding.
For more information, contact:
Montero Mining and Exploration Ltd.
Dr. Tony Harwood, President and Chief Executive Officer
E-mail: ir@monteromining.com
Tel: +1 416 840 9197 | Fax: +1 866 688 4671
www.monteromining.com
Neither TSX Venture Exchange nor its Regulation Services Provider (as that term is defined in the policies of the TSX Venture Exchange) accepts responsibility for the adequacy or accuracy of this release.
CAUTIONARY STATEMENT REGARDING FORWARD-LOOKING INFORMATION: This news release includes certain "forward-looking information" within the meaning of applicable Canadian securities laws. Forward looking information includes, but is not limited to, statements, projections and estimates with respect to the Share Consolidation. Generally, forward-looking information can be identified by the use of forward-looking terminology such as “plans”, “expects” or “does not expect”, “is expected”, “budget”, “scheduled”, “estimates”, “forecasts”, “intends”, “anticipates” or “does not anticipate”, or “believes”, or variations of such words and phrases or state that certain actions, events or results “may”, “could”, “would”, “might” or “will be taken”, “occur” or “be achieved”. Such information is based on information currently available to Montero and Montero provides no assurance that actual results will meet management's expectations. Forward-looking information by its very nature involves inherent risks and uncertainties that may cause the actual results, level of activity, performance, or achievements of Montero to be materially different from those expressed or implied by such forward-looking information. Actual results relating to, among other things, completion of the agreement, results of exploration, project development, reclamation and capital costs of Montero’s mineral properties, and financial condition and prospects, could differ materially from those currently anticipated in such statements for many reasons such as: an inability to complete the agreement on the terms as announced or at all; changes in general economic conditions and conditions in the financial markets; changes in demand and prices for minerals; litigation, legislative, environmental and other judicial, regulatory, political and competitive developments; technological and operational difficulties encountered in connection with Montero’s activities; and other matters discussed in this news release and in filings made with securities regulators. This list is not exhaustive of the factors that may affect any of Montero’s forward-looking statements. These and other factors should be considered carefully and accordingly, readers should not place undue reliance on forward-looking information. Montero does not undertake to update any forward-looking information, except in accordance with applicable securities laws.

