3... 2... 1... Let the Gold Corrective Rally Begin / Commodities / Gold and Silver 2021

Folks, it seems that gold has formedan interim bottom, and a short-term corrective upswing is now likely, beforethe medium-term downtrend resumes.
Any further declines from this point arenot likely to be significant for the short-term. The same applies to silver andthe miners.
In yesterday’s(Mar. 4) intraday Gold & Silver Trading Alert , I describedbriefly why I think that the very short-term bottom is already in (or is athand), and in today’s analysis, I’ll illustrate my points with charts. Let’sstart with gold.
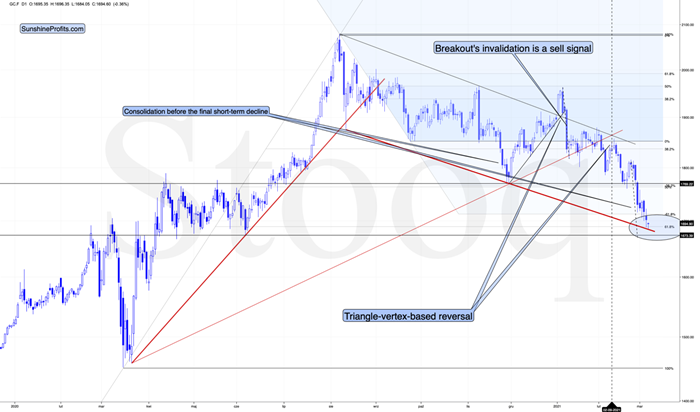
Figure1 – COMEX Gold Futures (GC.F)
Gold just reached its 61.8% Fibonacciretracement level (based on the entire 2020 rally), and it just bounced off thedeclining red support line based on the August and November 2020 bottoms.
Gold didn’t reach the previous 2020 lows just yet, but it moved veryclose to them and the two strong above-mentioned support levels could be enoughto trigger a corrective upswing. After all, no market can move up or down in astraight line without periodic corrections.
I previously wrote that when gold moves$1,693 we’ll be closing any remaining short positions, and when gold moves to$1,692, we’ll automatically open long positions in the miners. Since gold movedbelow $1,690, that’s exactly what happened.
Yesterday (Mar. 4), gold futures weretrading below $1,692 for about 10 minutes, so if you acted as I had outlined itin the Gold & Silver Trading Alerts, you made your purchases then. The GDXETF was trading approximately between $30.80 and $31 (NUGT was approximatelybetween $49.30 and $50) at that time – this seems to have been the exact dailybottom.
One of the bullish confirmations camefrom the silvermarket .
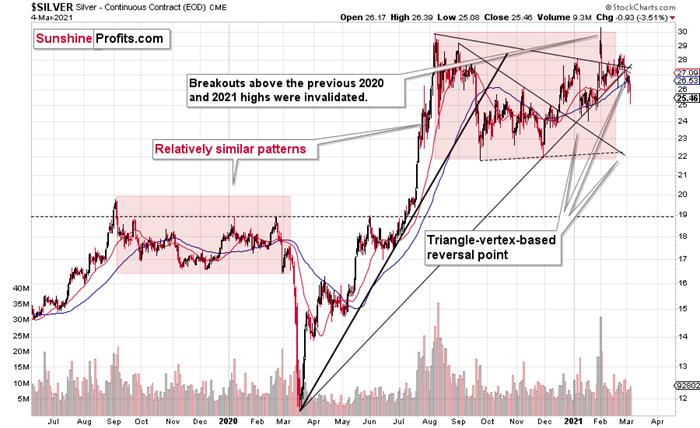
Figure2 – COMEX Silver Futures
I previously wrote that silver is likely tocatch up with the decline at its later stage, while miners arelikely to lead the way.
While gold miners showed strengthyesterday, silver plunged over 4% before correcting part of the move.Yesterday’s relative action showed that this was most likely the final part ofa short-term decline in the precious metals sector, and that we should nowexpect a corrective rebound, before the medium-term decline resumes. If not, itseems that the short-term bottom is at hand and while silver might stilldecline somewhat in the very short term, any declines are not likely to besignificant in case of the mining stocks. At least not until they correct therecent decline by rallying back up.
Speaking of mining stocks, let’s take alook at the GDX ETF chart.
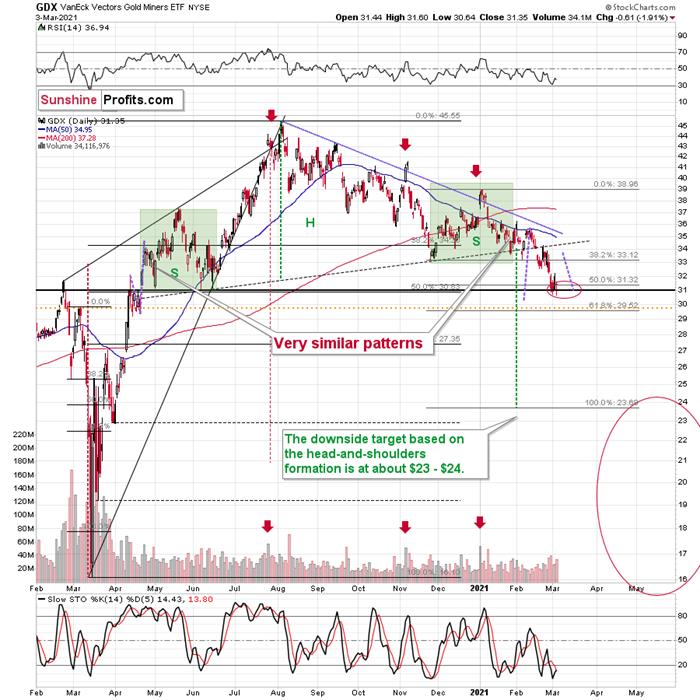
Figure3 - VanEck Vectors Gold Miners ETF (GDX)
Mining stocks showed strength yesterday.Even though gold moved visibly to new yearly lows, the GDX didn’t move to newintraday lows. The GDXJ did move to new intraday lows, but the decline wasrelatively small compared to what happened in gold and to what happened on thegeneral stock market. The latter declined substantially yesterday and the GDXJis more correlated with it than GDX – hence GDXJ’s underperformance was normal.Still, compared to both gold’s decline and stocks’ decline, the GDXJ and GDXdeclined very little.
The price level at which miners showedstrength matters greatly too. Miners stopped their decline practically right inmy target area, which I based on the 50% Fibonacci retracement and the 2020highs and lows. Moreover, the proximity of the $31 level corresponds to the2019 high and the 2016 high. Since so many support levels coincide at the sameprice (approximately), the latter is likely to be a very strong support.
Moreover, the RSI was just close to 30, which corresponded to short-term buying opportunitiesquite a few times in the past.
How high are miners likely to rally fromhere before turning south once again? The nearest strong resistance is providedby the neck level of the previously broken head and shoulders pattern, which isslightly above $34.
Also, let’s keep in mind the mirrorsimilarity in case of the price action that preceded the H&S pattern andthe one that followed it. To be precise, we know that the second half of thepattern was similar to its first half (including the shape of pattern’sshoulders), but it’s not yet very clear if the follow-up action after thepattern is going to be similar to the preceding price action. It seems quitelikely, though. If this is indeed the case, then the price moves that I markedusing green and purple lines are likely to be at least somewhat similar.
This means that just as the late-April2020 rally was preceded by a counter-trend decline, the recent decline wouldlikely be followed by a counter-trend rally. Based on the size of the Aprilcounter-trend move, it seems that we could indeed see a counter-trend rally toabout $34 this time.
There’s also an additional clue thatmight help you time the next short-term top, and it’s the simple observationthat it was relatively safe to exit one’s long positions five trading daysafter the bottom.
That rule marked the exact bottom inNovember 2020, but it was also quite useful in early February 2021. In earlyDecember 2020, it would take one out of the market only after the very firstpart of the upswing, but still, let’s keep in mind that it was the “easy” partof the rally. The same with the October 2020 rally. And now, since miners areafter a confirmed breakdown below the broad head and shoulders pattern, it’sparticularly important not to miss the moment to get back on the short side ofthe market, as the next move lower is likely to be substantial. Therefore,aiming to catch the “easy” part of the corrective rally seems appropriate.
So, if the bottom was formed yesterday, then we can expect to take profits from thecurrent long position off the table close to the end of next week.
Finally, let’s take a look at the USDIndex.
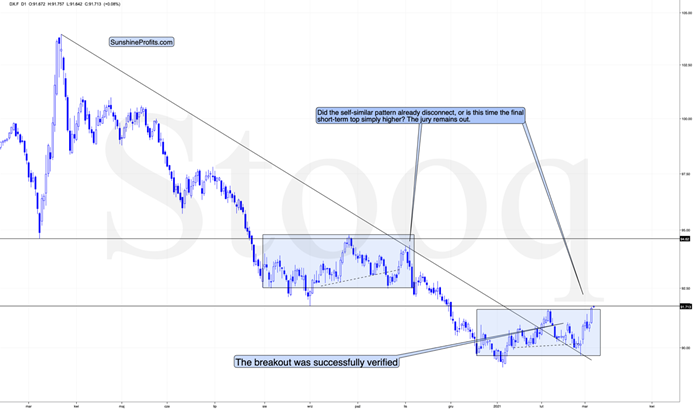
Figure 4 – USD Index
While the medium-term breakout continuesto be the most important technical development visible on the above chart (with important bullish implications forthe following months), there is one factor that could make the USD Indexdecline on a temporary basis.
This factor is the similarity to themid-2020 price pattern. I previously commented on the headand shoulders pattern that had formed (necklines are marked with dashed lines), but that I didn’t trust.Indeed, this formation was invalidated, but a bigger pattern, of which thisformation was part, wasn’t invalidated.
The patterns start with a broad bottomand an initial rally. Then it turns out that the initial rally is the head of ahead-and-shoulders pattern that is then completed and invalidated. This isfollowed by a sharp rally, and then a reversal with a sizable daily decline.
So far, the situations are similar.
Last year, this pattern was followed by adecline to new lows. Now, based on the breakout above the rising medium-termsupport line, such a bearish outcome doesn’t seem likely, but we might see thepattern continue for several more days, before they disconnect. After all, thistime, the USD Index is likely to really rally – similarly to how it soared in2018 – and not move to new lows.
What happens before the patternsdisconnect? The USD Index could decline temporarily.
Back in November 2020, the second top wasbelow the initial one, and we just saw the USD Index move to new yearly high.Did the self-similar pattern break yet? In a way yes, but it doesn’t mean thatthe bearish implications are completely gone.
In mid-2020, the USD Index topped aftermoving to the previous important intraday low – I marked it with a horizontalline on the above chart.
Right now, the analogous resistance isprovided by the September 2020 bottom and at the moment of writing these words,the USD Index moved right to this level.
Consequently, it could be the case thatwe see a decline partially based on the above-mentioned resistance andpartially based on the remaining self-similar pattern. The latter would belikely to lose its meaning over the next several days and would be decisivelybroken once the USD Index rallies later in March. The above would create aperfect opportunity for the precious metals sector to correct the recentdecline – and for miners (GDX ETF) to rally to $34 or so.
Please note that if gold rallies here –and it’s likely to – then this will be the “perfect” time for the gold andstock market permabulls to “claim victory” and state that the decline is overand that they were right about the rally all along. Please be careful whenreading such analyses in the following days, especially if they come frompeople that have always been bullish. If someone is always bullish, the oddsare that they won’t tell you when the next top is going to be (after all, thiswould imply that they stop being bullish for a while). Just because anyone canpublish an article online, doesn’t mean that they should, or that others shouldfollow their analyses. The internet is now replete people who claim to haveexpertise in the markets, and we all saw what happened to the profits of thosewho bought GameStop at $300. It’s the same thing that happened to the profitsof those who were told since the beginning of this year that gold is going torally – they turned into losses. What we see as well are internet echochambers, where you are more likely to only read articles that express what youalready agree with, instead of being exposed to differing viewpoints that shedlight on other critical factors.
Gold is likely to rally from here, butit’s highly unlikely that this was the final bottom, and that gold can now soarto new highs. No. The rally in the USD Index has only begun and while it couldpull back, it’s likely to soar once again, similarly to how it rallied in 2018.And gold is likely to respond with another substantial wave lower. This doesn’tmean we’re permabears either or that we want to see gold fail. On the contrary,gold has a bright future ahead, but not before it goes through a medium-termdecline after this corrective rally is over.
Thank you for reading our free analysistoday. Please note that the above is just a small fraction of today’sall-encompassing Gold & Silver Trading Alert. The latter includes multiplepremium details such as the targets for gold and mining stocks that could be reached in the next few weeks. If you’dlike to read those premium details, we have good news for you. As soon as yousign up for our free gold newsletter, you’ll get a free 7-day no-obligationtrial access to our premium Gold & Silver Trading Alerts. It’s really free– sign up today.
Thank you.
Przemyslaw Radomski, CFA
Founder, Editor-in-chief
Toolsfor Effective Gold & Silver Investments - SunshineProfits.com
Tools für EffektivesGold- und Silber-Investment - SunshineProfits.DE
* * * * *
About Sunshine Profits
SunshineProfits enables anyone to forecast market changes with a level of accuracy thatwas once only available to closed-door institutions. It provides free trialaccess to its best investment tools (including lists of best gold stocks and best silver stocks),proprietary gold & silver indicators, buy & sell signals, weekly newsletter, and more. Seeing is believing.
Disclaimer
All essays, research and information found aboverepresent analyses and opinions of Przemyslaw Radomski, CFA and SunshineProfits' associates only. As such, it may prove wrong and be a subject tochange without notice. Opinions and analyses were based on data available toauthors of respective essays at the time of writing. Although the informationprovided above is based on careful research and sources that are believed to beaccurate, Przemyslaw Radomski, CFA and his associates do not guarantee theaccuracy or thoroughness of the data or information reported. The opinionspublished above are neither an offer nor a recommendation to purchase or sell anysecurities. Mr. Radomski is not a Registered Securities Advisor. By readingPrzemyslaw Radomski's, CFA reports you fully agree that he will not be heldresponsible or liable for any decisions you make regarding any informationprovided in these reports. Investing, trading and speculation in any financialmarkets may involve high risk of loss. Przemyslaw Radomski, CFA, SunshineProfits' employees and affiliates as well as members of their families may havea short or long position in any securities, including those mentioned in any ofthe reports or essays, and may make additional purchases and/or sales of thosesecurities without notice.
Przemyslaw Radomski Archive |
© 2005-2019 http://www.MarketOracle.co.uk - The Market Oracle is a FREE Daily Financial Markets Analysis & Forecasting online publication.