Are Gold And Gold Miners A Good Bear Market Hedge?
Gold and ETFs like the GLD tend to rise in value when the market falls but the relationship is weak.
Gold mining stocks and ETFs like GDX are positively correlated to the stock market and make a terrible hedge against market weakness.
Real interest rates as measured by the yield on 5-Year TIPS have much stronger correlation to gold than the S&P 500.
Investors should buy GLD and GDX in the later stages of a bull market but sell GDX when the bear market begins.
Gold and gold mining stocks are often recommended interchangeably as a hedge against weakness in the broader stock market based on the view gold is a "safe haven" when the market tumbles.
However, historic precedent suggests investors should be careful buying gold solely as a hedge against market weakness and should consider selling gold mining stocks outright when the S&P turns lower.
Here's a scatter chart showing monthly changes in the price of gold and the S&P 500 over the past 30 years.

Source: Bloomberg; GLC Investing
The chart shows monthly changes in the price of gold plotted on the y-axis (the vertical axis) compared to changes in the price of the S&P 500 plotted on the x-axis (horizontal). There is a slight negative slope to the trendline plotted in red indicating that gold prices are inversely correlated to the S&P 500; in other words, when the S&P 500 falls in value, gold tends to rise.
However, even a cursory glance shows the relationship between the stock market and gold prices is weak with most of the data points located far away from the fitted trendline. The R-squared value measures the predictive power of the relationship where a value of 0 indicates no predictive power and a value of 100% indicates perfect correlation between the two values. So, the value of 0.3% highlighted on the chart further underlines the weakness of this relationship.
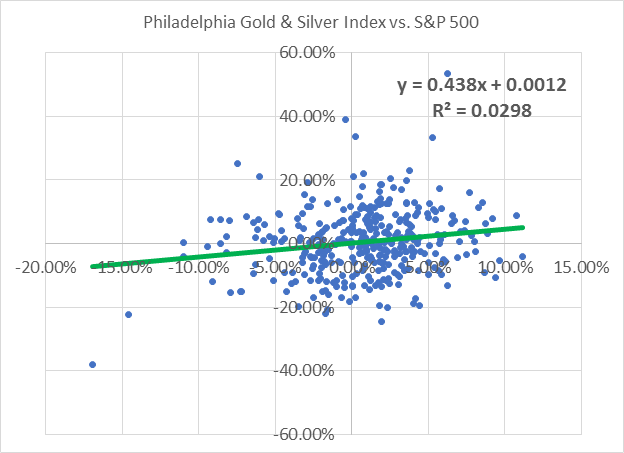
Here's a chart based on monthly data over the same 30-year period, substituting changes in the price of the Philadelphia Gold & Silver Index - a capitalization-weighted index of gold and silver mining stocks - for the price of gold itself.
Source: Bloomberg; GLC Investing
The good news: the relationship between returns in the S&P 500 and the prices of gold mining stocks is (slightly) stronger than the correlation between gold and the stock market. However, the bad news is that these two series are positively correlated - in other words, the prices of gold mining stocks and the S&P 500 have tended to move in the same direction over the past three decades.
If you're looking for a hedge against market declines, you want to see a negative correlation; therefore, history suggests buying individual gold mining stocks or an ETF like the VanEck Vectors Gold Miners (GDX) as a hedge against falling stock prices is a poor strategy.
One point to note is that while the relationship between changes in gold mining stocks and the S&P 500 is weak - the R-squared value is a low 3% - this lack of correlation between the market and gold stocks can be useful for diversification purposes over the long-haul.
That's because most stock indexes are highly correlated to the broader market.
Source: Bloomberg; GLC Investing
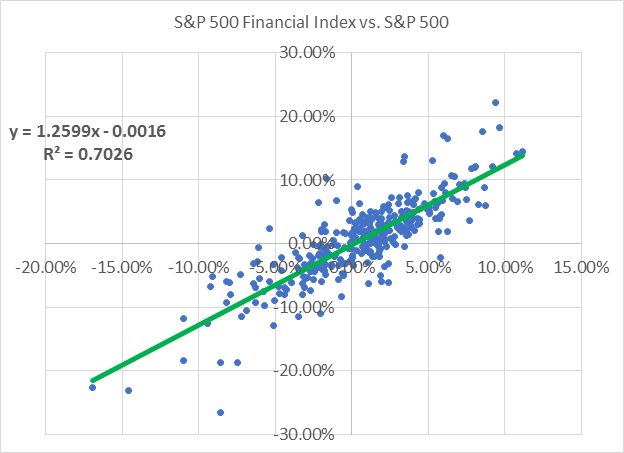
This chart plots changes in the S&P 500 Financials Index against changes in the S&P 500 since 1989. As you can see, these two indexes are strongly positively correlated with an R-squared value of more than 70%. While the performance of financials and the S&P 500 can diverge over time, buying banks and insurance companies is, at least in part, a call on higher stock prices.
The same strong positive correlation holds for most market sectors, including industrials and technology stocks.
That makes groups with a weaker bond to the broader market - including gold stocks and utilities - useful holdings in the context of a broadly diversified portfolio.
During Bear Markets buy Gold NOT the Miners
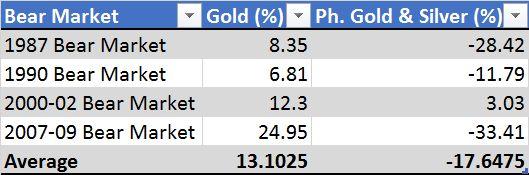
Since 1987, there have been four bear markets for the S&P 500 defined as peak-to-trough closing declines of 20% or more. Here they are:
?EUR? August 25, 1987 to December 4, 1987 the S&P 500 fell 33.5% peak-to-trough
?EUR? July 16, 1990 to October 11, 1990 the S&P 500 fell just under 20% peak-to-trough (not technically a bear market but usually considered one)
?EUR? March 24, 2000 to October 9, 2002 the S&P 500 fell 49.1% peak-to-trough
?EUR? October 9, 2007 to March 9, 2009 the S&P 500 fell 56.8% peak-to-trough
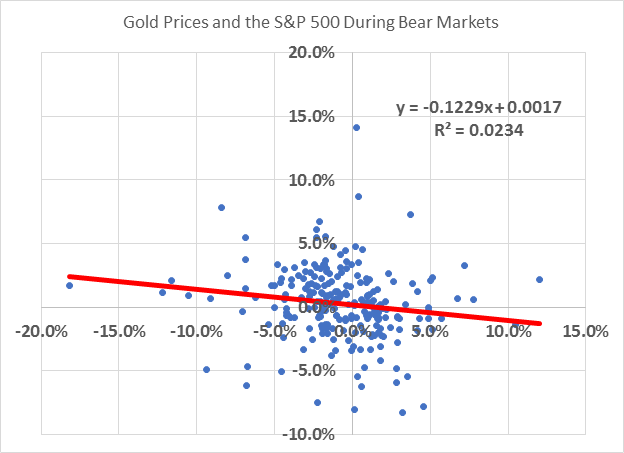
This chart compares weekly changes in the S&P 500 during these 4 bear markets (a total of 230 weekly observations) with weekly changes in the price of gold:
Source: Bloomberg; GLC Investing
The inverse relationship between changes in the spot price of gold and changes in the price of the S&P 500 is tighter during bear markets than for the entire 30-year period referenced earlier in this article. However, an R-squared value of 2.3% still indicates only a weak correlation during bear markets.
Finally, check out this chart:
Source: Bloomberg; GLC Investing
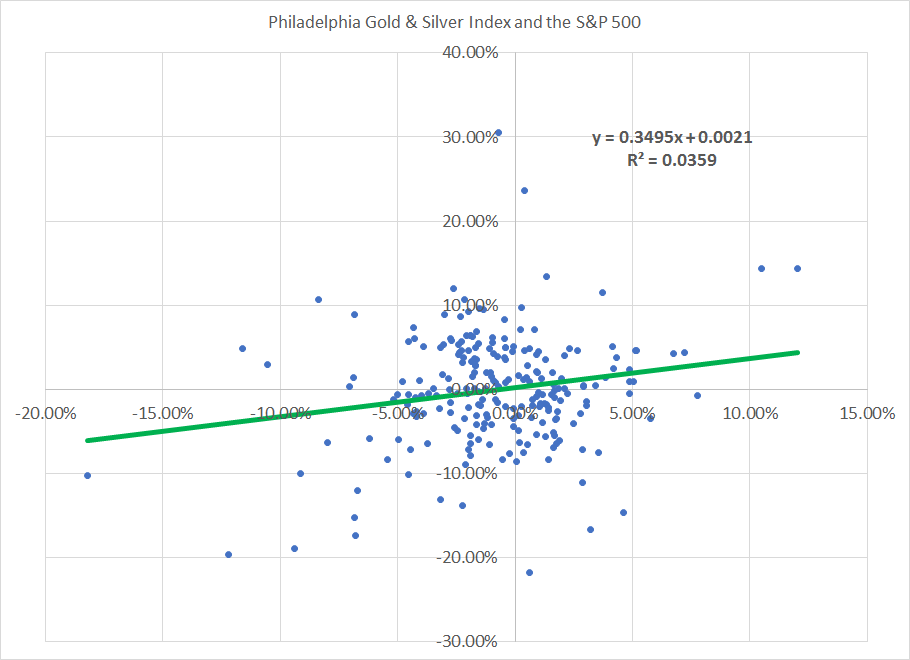
During the past four US bear markets, the positive weekly correlation between gold and silver mining stocks and the S&P 500 is somewhat stronger than for the entire 30-year period. That means during bear markets, gold mining stocks have historically been a particularly poor hedge against market weakness.
Source: Bloomberg; GLC Investing
The good news is that while the weekly correlation between changes in gold and stock prices is poor, even during the past four US bear markets, gold has tended to rise generally over these periods. The average return from holding gold over the past four bear markets is 13.1%.
On this basis, owning gold mining stocks remains an ill-advised market hedge - the Philadelphia Gold & Silver Index has dropped in 3 of the past 4 US bear markets for an average return of -17.7%.
Investors looking for a way to explain short-term moves in the price of gold should consider moves in real interest rates as measured by the yield on the 5-Year Treasury Inflation-Protected Securities (TIPS). As I explained in "Will Rising Rates and Fed Hikes Sink Gold?" the inverse relationship between the yield on TIPS and the price of gold has been tight over the past 20 years with an R-squared value of 77.4%.
As concluded in that article, the relationship between gold and real rates has broken down since the spring of 2017, as it has historically tended to do in the final stages of bull markets.
Alongside the recent break in correlation between real rates and gold prices, the recent up-tick in stock market volatility and inflation and the flattening US yield curve all suggest we're entering the final 12 to 24 months of the long S&P 500 bull market that started in 2009. Accordingly, long-term investors should consider holding gold or an ETF like the SPDR Gold Trust (GLD) at this stage of the stock market and economic cycle.
Furthermore, given continued strength in the US economy, we believe the S&P 500 will see new highs by this summer and that the late-January market top does not mark the end of this bull market. The recent downdraft, though violent, bears all the hallmarks of a late-cycle market correction, not a top. Accordingly, we believe it remains an opportune time to purchase select gold mining stocks or an ETF like the GDX, which tends to follow gold prices higher late in an economic and market cycle.
However, when the US does enter a new bear market, investors should consider holding on to gold and the GLD while selling out of the mining stocks, which have tended to follow the market lower.
Disclosure: I am/we are long GLD, GDX.
I wrote this article myself, and it expresses my own opinions. I am not receiving compensation for it (other than from Seeking Alpha). I have no business relationship with any company whose stock is mentioned in this article.