Bitcoin And Gold: An Inverse Relationship
There appears to an inverse relationship between Bitcoin and gold: one moves up, the other moves down; one moves down, the other moves up.
Based on Elliott Wave analysis, Bitcoin appears to have made a new low and is poised for a move up in the coming week.
The Bitcoin Investment Trust is a margin-free instrument that is traded on the OTC and allows traders with a set strategy to take advantage of Bitcoin's extreme volatility.
Gold appears to be heading into a bearish period which suggests you should sell gold.
Based on my analysis, you should buy Bitcoin and sell gold in the coming week.
As I was reading the last report I published in Seeking Alpha on January 8, 2018, "Bitcoin: A Trader's Dream" and the commentaries, I could not help but take a look at the relationship of Bitcoin and gold since the inception of the Bitcoin futures market on December 10, 2017. What I found is a very interesting relationship between the price of Bitcoin and gold as an inter-market relationship.
What we have seen with the Bitcoin phenomenon is the creation of a virtual currency which has established itself as a major asset. When you take a look at the amount of capitalization it has taken away from the market, either in gold and silver or stocks and bonds - we really don't know from where - close to a $1 trillion has gone into Bitcoin. The increase in the price of Bitcoin has outdone almost anything in history. What I find interesting is that when you analyze what has taken place, it has demonstrated what can happen to the actual price structure of an asset in a free enterprise environment that is not controlled by central banks or a government. It has put into question the actual discovery process of fair values in any asset across the board, including gold, silver, stocks, bonds, and every other asset. You can look at other assets and begin to see that these assets have been a product of major manipulation over the past 90 years at least. The difference is that technology now is breaking down the veil of that manipulation and is allowing the public to see what can be done with this amazing technology behind Bitcoin which really is the source of the tremendous demand for cryptocurrency: Blockchain technology.
Gold-Bitcoin Relationship
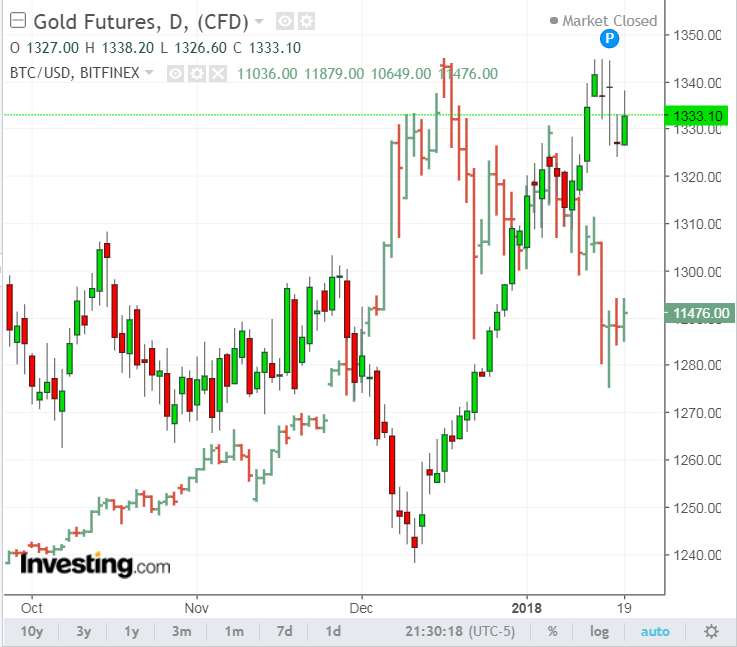
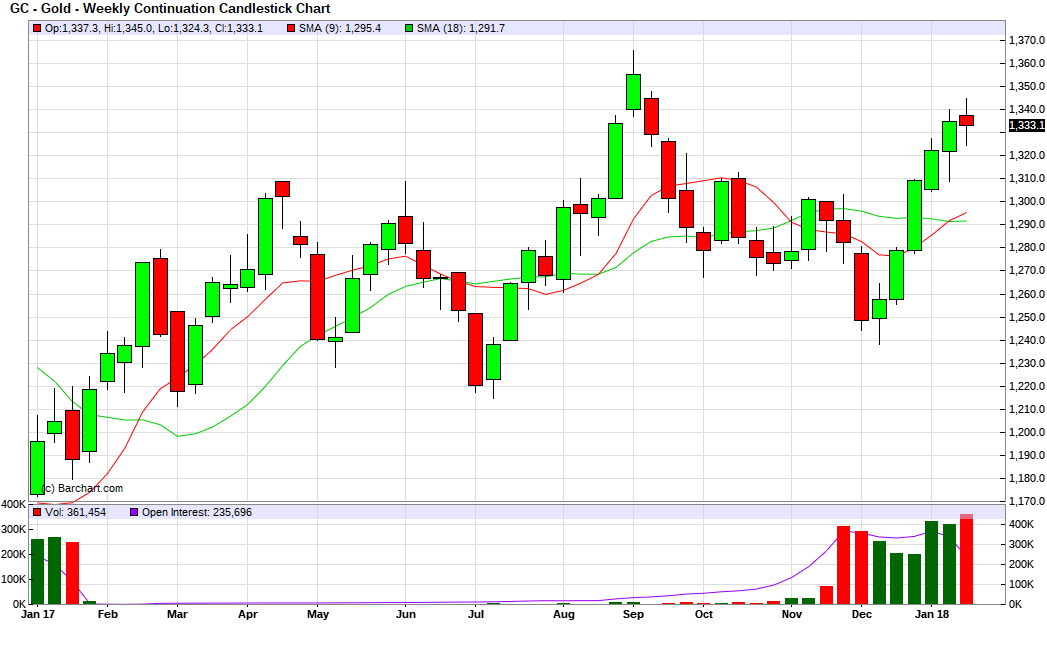
Since the inception of the Bitcoin futures market on December 10, 2017, the price of Bitcoin made a high of $19,171, shattering all records. When Bitcoin was trading at the new highs, the price of gold was trading at about $1,265, and since December 10, the price of gold has risen to the high that we saw last week of $1,344.50. Since then, the price of Bitcoin collapsed from the high of $19,171 to a low last week of $9,231. This accomplished and completed the reversion to the mean targets into the standard deviation levels of 11,820 and 7,712 published on Jan. 8, in Seeking Alpha.
I specifically emphasized my recommendation during this time period when we published the report that Bitcoin was a short-term trade and you should buy gold for the longer-term. It appears that this is exactly what happened. It has validated that there is a new kid on the block who is trading the other side of the coin as a virtual currency in competition with the fiat dollar against physical gold.
Fortunately, the VC PMI algorithm has validated that the implied volatility of Bitcoin and the cyclical analysis that we use in the gold market are very similar in their nature and results. We are seeing there is a close inverse relationship between gold and Bitcoin.
The price of Bitcoin on March 10, 2017, surpassed the price of gold when Bitcoin went through $1,200. The price of gold continued to rise to make a high of $1,362.40 on September 11, 2017, followed by a steep correction back down to $1,238 an ounce as of December 11, 2017. Sometime on December 7, 2017, the price of Bitcoin exploded and accelerated into the high that was established on December 18 of $19,271, making a major top while the price of gold was trading at $1,241 before making a low of $1,238. Since then, we have seen gold run up aggressively to the high last week of $1,345, while once again the low on Bitcoin was made at $9,231.
What this inter-market relationship tells us is that there is a close inverse relationship between gold and Bitcoin. We are going to continue to watch this closely because it is telling us that we should be buying Bitcoin and selling gold as of last Friday.
Just to review some of the activity that took place, we can see that December 16 was Bitcoin's highest daily close and that December 17 marked the intra-spike high that took place in Bitcoin. Since then, it has dropped as much as $9,000 or about 50% in a matter of days before it rebounded sharply, as it usually does. Bitcoin is going to continue to show this kind of volatility. This kind of volatility is a trader's dream if you have a system for trading this kind of market. It is not for the light-hearted. It is not for the amateur or beginner. Embrace this volatility but do it intelligently by educating yourself first. It's pretty obvious that Bitcoin has taken away some of the luster from the gold market. Once again, this may be the beginning of a major inter-market relationship, but only time will tell.
Bitcoin and Elliott Waves
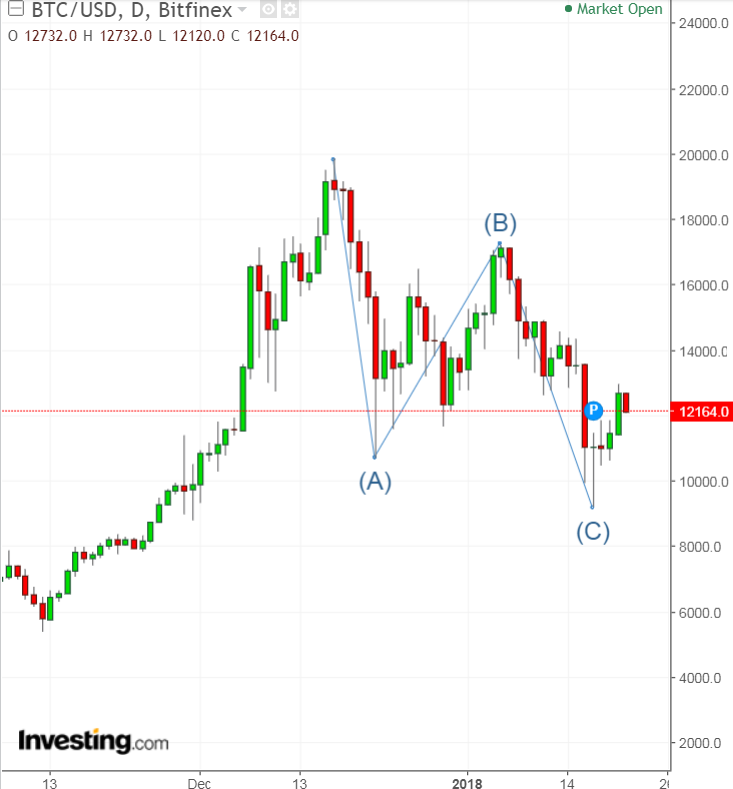
Bitcoin has reached a real pivotal point. Referring to the charts, it has made a bottom within the expected cycle date, which we expected to be around the middle of January 2018. If you are an Elliott Wave analyst, you can appreciate that Bitcoin appears to be tracing a very close relationship to Elliott Wave analysis by tracing out an ABC correction from its mid-December peak. The C-wave decline that began on January 6 would match the duration of the A-wave decline of December 16-30 if it ran its course sometime around January 18-20. A similar C=A wave price objective has projected a drop to $9,400 for Bitcoin, which coincides with its 50% downside target that was accomplished at $9,600. If a low is validated during this time frame of January 18-20, it would arrive at exactly 180 degrees or about six months from July 16-17, 2017, low when Bitcoin completed a lesser-degree correction after a 40 percent decline and held its fourth wave of lesser-degree support at the May 27 low. It also entered its latest five-month advance which was expected. If this low is validated during this time frame, it will fulfill a 180-degree low cycle progression. Another interesting relationship to the gold and silver market is that Bitcoin has maintained a 120-degree or four-month cycle, which is the same cycle that has prevailed in precious metals for the past three or four years. Bitcoin created a four-month low which projected the anticipated low during the January 18-20 period.
GBTC: A Trader's Dream
We are not taking advantage of Bitcoin's volatility by investing in the futures market, which has high margin risk. It is not really tradable for the light-hearted or for the un-capitalized investor. I am sharing with you one of the instruments that offer no margin to take advantage of Bitcoin's volatility. This instrument trades like a security and offers the volatility for the Variable Changing Price Momentum Indicator (VC PMI) to produce and identify trades using the reversion to the mean with 95% probability. I am looking at GBTC, which is the Bitcoin Investment Trust (OTCQX:GBTC), traded on the New York Stock Exchange.
Mean Reversion Trading in Bitcoin Investment Trust
We have applied our proprietary Variable Changing Price Momentum Indicator (VC PMI) to GBTC. The primary driver of the VC PMI is the principle of reversion to the mean ("Mean Reversion Models of Financial Markets", "The Power of Mean Reversion in Factor-Based Investing"), which is combined with a range of analytical tools, including fundamental logic, wave counts, Fibonacci ratios, Gann principles, supply and demand levels, pivot points, moving averages, and momentum indicators.
Mean-reversion trading seeks to capitalize on extreme changes in the price of a particular security, commodity or cryptocurrency, based on the assumption that it will revert to its previous state. This theory can be applied to both buying and selling, as it allows a trader to profit on unexpected upswings and buy low when an abnormal low occurs.
By identifying the average price (the mean) or price equilibrium based on yesterday's supply and demand factors, we can extrapolate the extreme above this average price and the extreme below it. When prices trade at these extreme levels, it is between 90% and 95% probable that prices will revert back to the mean by the end of the trading session. I used this system to analyze the Bitcoin market.
Let's take a look at GBTC trading instructions for January 19, 2018. The contract closed at $1,768. In using the first VC PMI filter, with the market closing above the nine-day moving average $1,334, it confirms that the trend is bullish. The VC PMI also identifies for us the inverse relationship or reversion to the mean and gives us the alternative; if the market closes below this pivot point, it would shift the trend momentum to neutral. If it closed above $1,334, then it is a bullish indication, but if it closes below $1,334, it would negate this bullishness in the short term. The VC PMI thereby provides you with a defined structure to use as your stops or protective levels for risk management.
Courtesy: ema2tradelivesignals.com
The second filter that we use is the VC PMI weekly price momentum indicator. Coming into next week, this identifies for us the average price, which is $1,697. It also confirms for us that because the Bitcoin market closed above this average price, we are coming into this week with a bullish price momentum.
The VC PMI also identifies the alternative; if the market closes below $1,697, it would negate this bullishness and you should go neutral. You can also use this as a second stop level or protective risk level.
You can see how the algorithm lays out different levels of stops. It not only identifies the direction of the market by triggering a buy or a sell but it also tells you exactly where to place stops and where to take profits. With the market closing above $1,697, we are coming into this week with a bullish price momentum. The sell 1 level is $1,976, which is the first level of the extreme above the mean and the place to take some profits. The program is also able to identify a second level above the mean, which is the sell 2 level of $2,183, which is your second target. Because we came in bullish, look to take profits on longs at $1,976 to $2,183. So it gives you a definite structure with price levels to execute. Only the price action will determine the result.
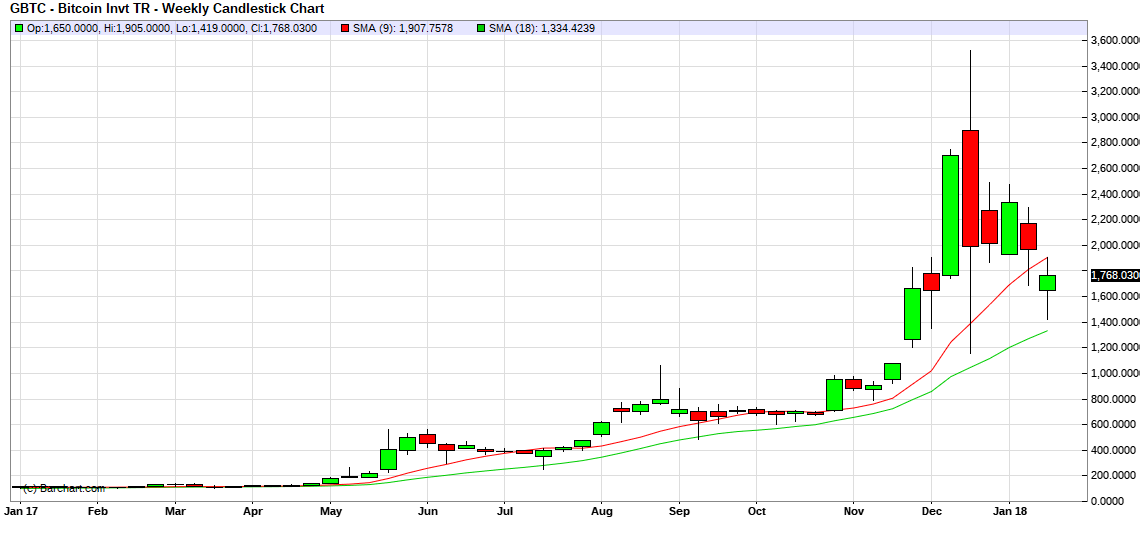
If the market does close below $1,697, then we could come down to the extreme below the mean buy 1 level of $1,489 or even the buy 2 level of $1,211. The buy 2 level is two standard deviations below the mean. If the market comes down to these levels, it tells you to cover any short positions and to reverse and go long. This is the extreme below the mean. At the buy 1 level, it is a 90% probability that the reversion will occur back up to the mean. At the buy 2 level, there is a 95% probability that the market will revert back up to $1,697. In this way, the VC PMI allows you execute intelligent trades.
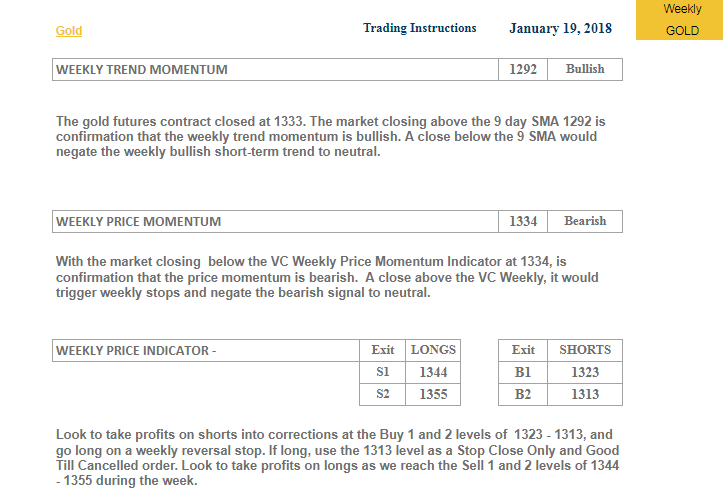
Gold S&D Weekly Levels
Courtesy: ema2tradelivesignals.com
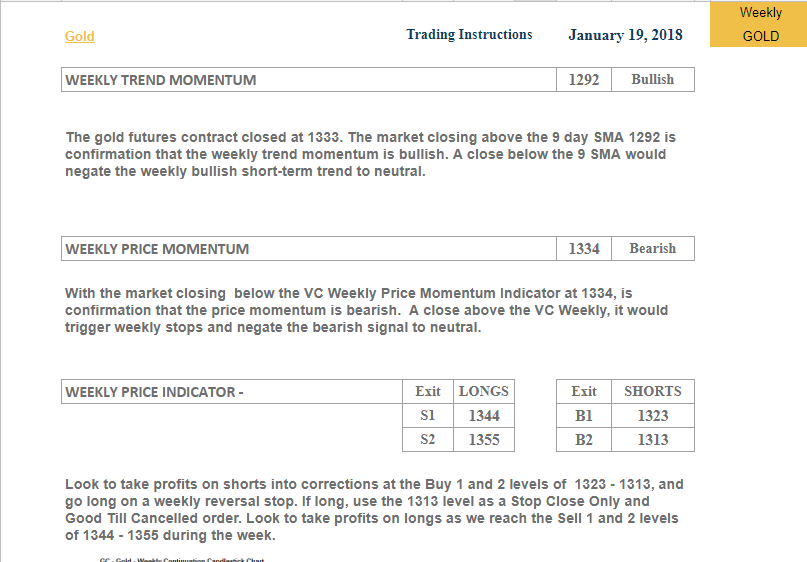
Let's take a look at the gold market for next week. The gold market closed at $1,333, above the first filter, which is the nine-day moving average of $1,292. Therefore, this gives us a weekly confirmation that the gold market is bullish. The algorithm also provides the inverse signal relationship; if the market closes below $1,292, it would negate this signal to neutral. So this is your first level to use as a protective stop.
The second filter that we use is the weekly price momentum, which is the weekly average price or mean. With the gold market closing below the weekly price momentum indicator of $1,334 for next week, it confirms that the weekly price momentum has turned bearish. But the algorithm tells us that if gold closes above $1,334, it would negate this short-term bearish signal to neutral.
It appears that the gold market is moving into a neutral to bearish zone. If we do get above $1,334 next week, it would negate this bearish sentiment. Because the market closed below $1,334, it has activated the signal to exit short positions at the buy 1 level of $1,323 and gives us a clear price level at the buy 2 level of $1,313. Look to take profits on any shorts into corrections at these levels of $1,323 to $1,313. If you are short coming into next week, these levels can be executed to lock in profits. If you have multiple positions, you can exit those positions in stages. If we do activate these levels, you should cover your short positions and go long, once activated. If the market goes down to $1,323, use $1,313 as your stop. Once the market reverses above $1,323, after touching it, or $1,313 after activating it, it activates the algorithm into a buy zone. The algorithm identifies these levels as demand or extreme below the mean levels. The buy 1 and buy 2 as well as the sell 1 and 2 levels are based on standard deviations above and below the mean.
We have used this VC PMI supply and demand structure to successfully trade gold and silver for years, and we are now applying the same analysis effectively to Bitcoin.
Buy Bitcoin, Sell Gold
Based on what we have seen unfold since December, the gold market has met all of the targets we provided since October 23, 2017. It may be that we are setting up for a potential correction in the gold market back into the low $1,300s. You should use the indicators that we provide to enter and exit specific trades for self-directed individuals. It appears that in terms of using Bitcoin Investment Trust, we came down to the levels of Buy 1 and Buy 2. As we come into this week, we want to watch very carefully the levels of demand in Bitcoin and the levels of supply in gold given the close relationship between the two markets. The algorithm's analysis of the market is telling us to buy Bitcoin and sell gold.
Disclaimer: The information in the Market Commentaries was obtained from sources believed to be reliable, but we do not guarantee its accuracy. Neither the information nor any opinion expressed herein constitutes a solicitation of the purchase or sale of any futures or options contracts. It is for educational purposes only.
Disclosure: I/we have no positions in any stocks mentioned, and no plans to initiate any positions within the next 72 hours.
I wrote this article myself, and it expresses my own opinions. I am not receiving compensation for it (other than from Seeking Alpha). I have no business relationship with any company whose stock is mentioned in this article.