China's astonishing rise in one simple chart
The slowdown in the Chinese economy has been front and centre for commodities markets for a long time, but today's its impact is felt on US interest rate policy and equity markets.
China's official GDP growth is expected to slow to less than 7% in 2015, the slowest pace in 25 years.
But even at this rate of growth the country would be adding some $700 billion to gross domestic product (and that's excluding Hong Kong).
That's greater than the size of mainland China's entire economy in 1994, when growth rates peaked at a stunning 30% year-on-year.
$700 billion is also bigger than Switzerland's economy and worth almost 2 South Africas and 4 New Zealands.
When compared to the US, the world's dominant economy for roughly the last 150 years, China's ascent is even more startling because it took place over such a short time-span.
And on a purchasing power parity (PPP) basis China's catch-up is nothing short of miraculous - in 2005 the percentage was just 43% of the US total.

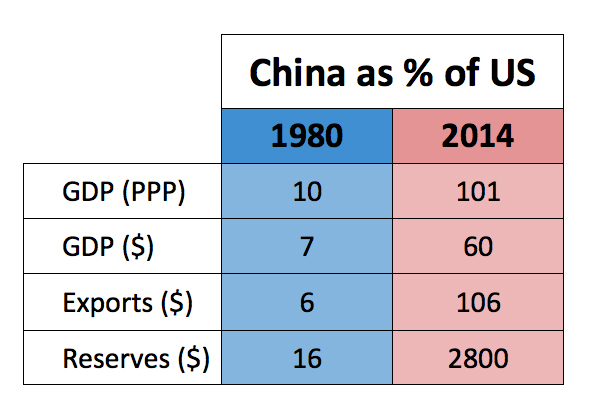
The table is from the Belfer Center for Science and International Affairs at Harvard and I stumbled on it in this article at the Atlantic.