Gold: A Long-Term View
Price was able to bounce back above $1,200 last week.
This is significant in the grander scheme of things.
Our research still favors the bullish side.
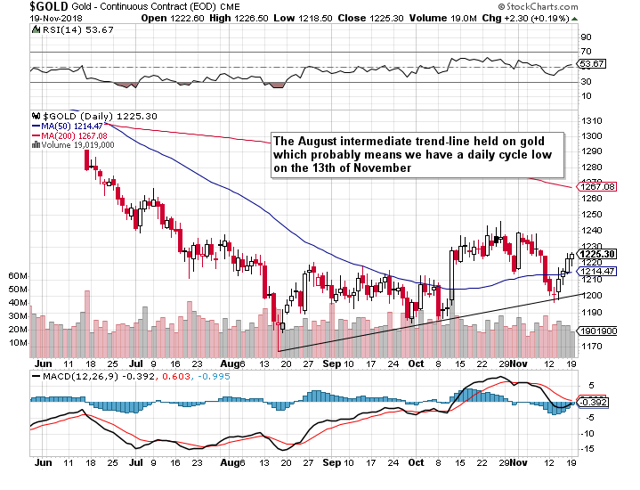
I uploaded a video on my blog a few weeks ago and went over the case for $1,200 holding on gold. Well, gold actually went lower on the 13th of this month although price quickly rebounded, thereafter, above the $1,200 psychological mark. The yellow metal since then has been able to tack on more gains in that we are now trading at the $1,223 level. The lesson here with respect to the supporting trend-line basically being able to support the gold price is that one must always trade with a margin of safety both from the perspective of that $1,200 an ounce physiological number as well as the supporting intermediate trend-line. Many long traders of gold would have actually liquidated their holdings once $1,200 was breached. Price actually went to a low of just over $1,196 an ounce on the 13th before rebounding. However, if one had used maybe a safety net of say 0.05%, the proper stop would have been $1,294 which would have meant long plays could have stayed intact.
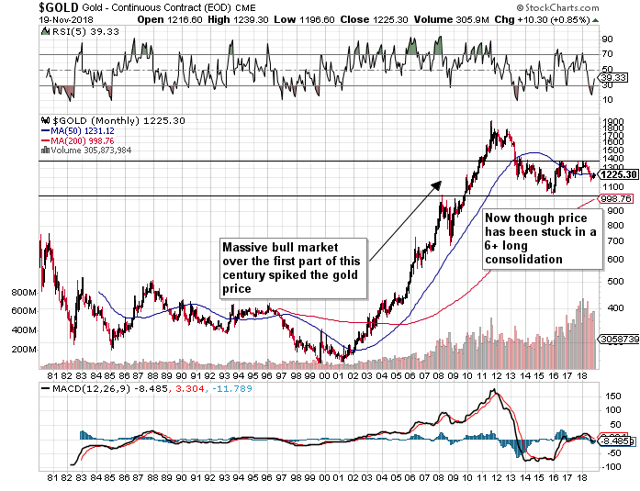
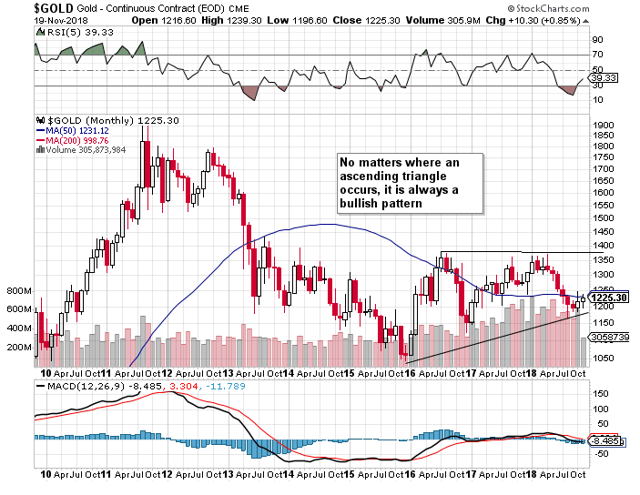
So, we most likely have some gold investors who are still on the sidelines because they are unsure of future direction. Price has been in a long-term consolidation pattern since 2013. The crux of the issue whether this consolidation pattern in a continuation pattern or a reversal pattern over the previous trend. The price of gold went through a roaring bull market between 2001 and 2011. After a subsequent downturn which spanned around 2 years, price, as mentioned, has remained pretty range-bound over the past 6 years when viewed on the monthly chart. Therefore, the last clear direction of trend before this multi-year bear market was in the latter stages of 2012 and 2013 when price fell sharply (down-trend). Our job, therefore, is to ascertain whether that down-trend is going to eventually continue or will there be a reversal on the cards.
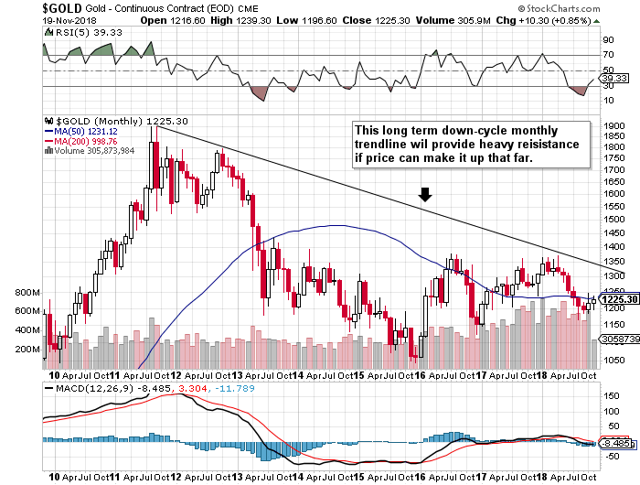
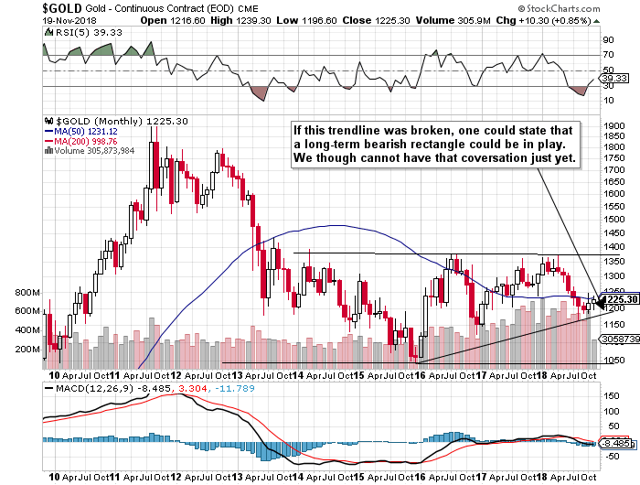
First though as the monthly down-trend line demonstrates, price really has to break above around $1,325 an ounce before confirming a break-out of this long-term consolidation. This trend-line due to having 3 different monthly highs hitting it carries meaningful weight, so it will probably act as tough resistance initially for gold to break through.
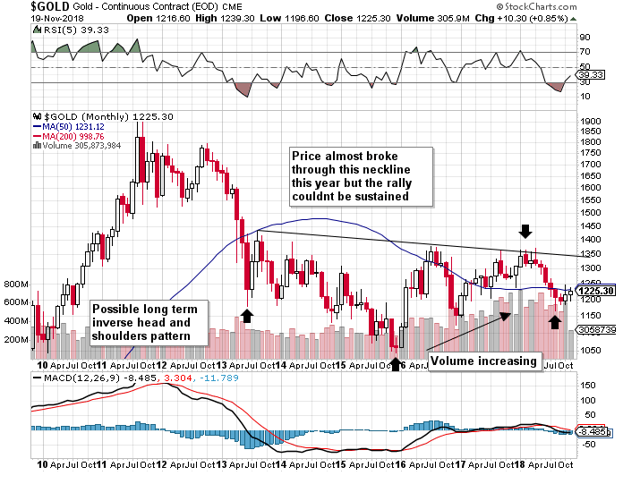
Before we discuss the possible patterns, traders should take note of the significance of this 6-year consolidation. The longer the consolidation, the longer the up or down-move which transpires in the aftermath. First, let's discuss a possible reversal pattern which would be bullish for gold. The pattern which is evident when looking at the chart is an inverse head and shoulders pattern. The December 2015 low would be the obvious head and volume has been increasing since the "head" which is indicative of this type of pattern. Obviously, we will not know whether this pattern plays out or not until the neckline gets broken but this looks like the most probable pattern at present.
Another possible reversal pattern would be the double bottom which would mean price would have to revert to the 2015 lows of around $1,050 before bouncing off that support. The increase in volume though makes me sway towards the inverse head and shoulders reversal pattern for now.
In terms of a continuation pattern, it is difficult to hypothesize a pattern due to how the 2016 lows affect the pattern. Furthermore, if we were to continue the downtrend from September 2011 to December 2015, the following pattern is an ascending triangle which is always bullish irrespective of when it occurs on a chart.
The only possible long continuation pattern at present would be a bearish rectangle where we would break the 2015 lows. I think this is what the bears are missing. Those lows and the higher lows ever since give gold a much higher probability of rallying from here instead of declining.
Therefore, to sum up, we continue to support the bullish view on gold over the long term. Major support has not been penetrated and the bullish ascending triangle is still in play along with the long-term inverse head and shoulders reversal pattern. Long-term call options though in this type of market should not be used as we still do not have a trending market. $1,325+ per ounce needs to be taken out first to confirm a clear breakout.
Disclosure: I/we have no positions in any stocks mentioned, and no plans to initiate any positions within the next 72 hours.
I wrote this article myself, and it expresses my own opinions. I am not receiving compensation for it (other than from Seeking Alpha). I have no business relationship with any company whose stock is mentioned in this article.
Follow Individual Trader and get email alerts