Gold: Higher Prices Short Term Or Buy Pullbacks?
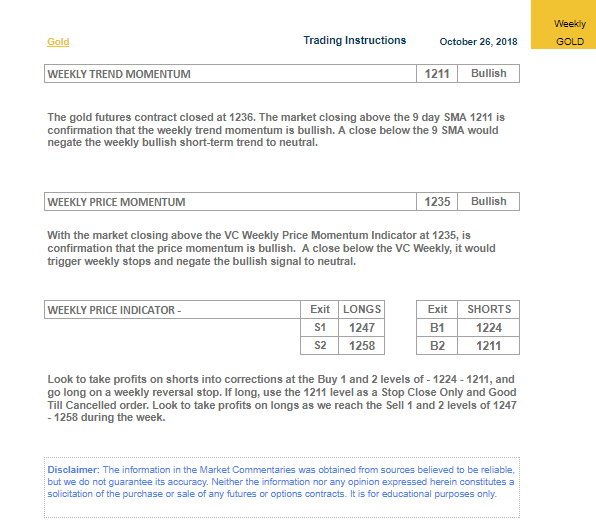
With gold closing around $1236, the market closing above the 9-day weekly moving average is confirmation that coming into this week we have a bullish trend momentum.
If the gold market closes above $1235, the first target this week is the sell 1 (S1) level of $1247, and the second target is the sell 2 (S2) level at $1258.
If the market comes down below $1235, it would negate this bullish trend to neutral and a second close below $1235 would activate the extreme below the mean of the buy 1 (B1) level of $1224 to the buy 2 (B2) level of $1211..
In this special weekend report, I want to review the gold and silver markets. Let's see what the Variable Changing Price Momentum Indicator (VC PMI) is telling us for gold as we come into next week.
Gold
On October 2, we published on Seeking Alpha the Long-term Annual Supply and Demand Report for the gold market. I want to look at what we published, where we are at the present time and what we can expect going forward.
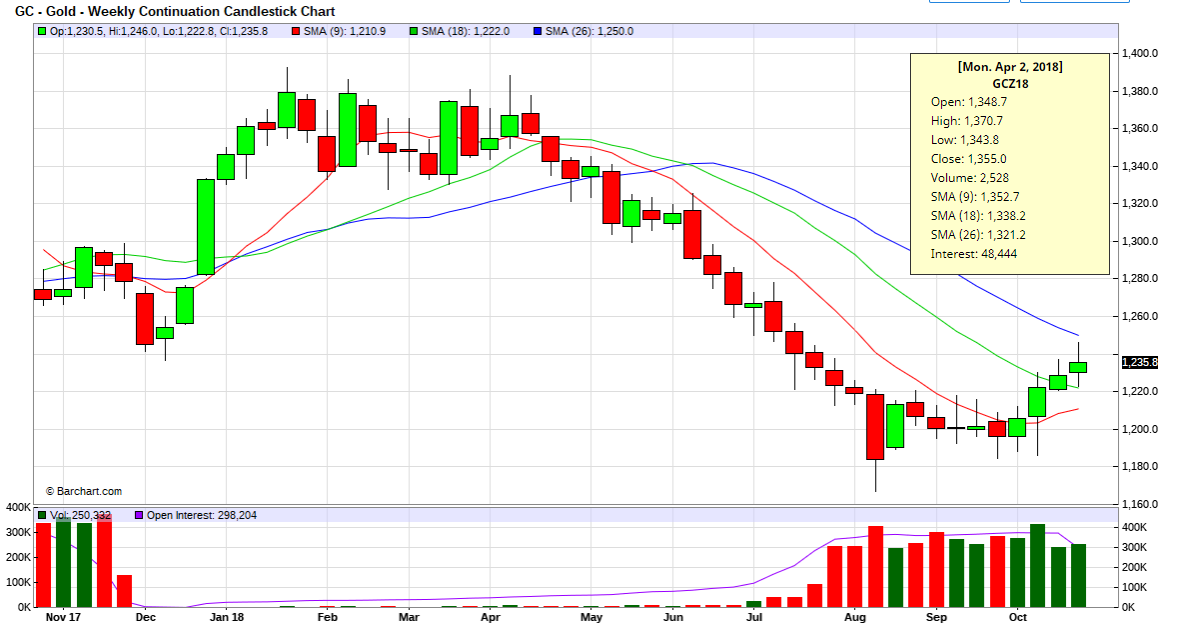
In that report, we analyzed the next long-term 360-day trend, starting September 28, 2018 through September 28, 2019. At the time of the report, gold was at $1196.20. We were able to identify the 50-day moving average as being at $1237 when the report was published on September 28, 2018.
"As we look at the current market," Patrick MontesDeOca, CEO of the Equity Management Academy said, "we can see that with the current price closing at $1236, gold has pretty much met the target of $1237, which was the 9-month moving average we identified in our long-term report based on the VC PMI."
Gold essentially came off a low of about $1167.50 that was made on August 13. The low that was anticipated to be made during this time was $1166, according to the VC PMI automated algorithm. It was close enough to call for a bottom of the market, which is what we had been writing about and suggesting in our Seeking Alpha reports since we published the long-term report.
"We've been suggesting to add to your positions at the B1 and B2 levels on the daily, weekly and monthly," MontesDeOca said, "especially if the harmonic alignment in price takes place between the daily, weekly and monthly. That is one of the strongest correlations we have identified, which increases the probability factor that the market on all three trends has completed its downside targets and is ready for a reversion to recur with better than 95% probability."
Such an alignment is a very good indicator to use to identify major turning points or swing trading opportunities, as well as long-term investment opportunities in the financial markets, including commodities, stocks, indexes, and ETFs.
Weekly S&D levels
Courtesy: ema2tradelivesignals.com
If you look at our October 26 report, with gold closing around $1236, the market closing above the 9-day weekly moving average is confirmation that coming into this week we have a bullish trend momentum. The VC PMI also tells us that if the market closes below $1211, this bullish trend momentum would be negated to neutral.
"So this algorithm," MontesDeOca said, "identifies for us the first level of protection that you may want to use to identify a reversal in the trend momentum. We use this as the first filter for self-directed individuals."
The second filter that we use is the price momentum indicator or the average price or mean. In this case, $1235 is the mean for gold for the coming week. With the market closing above $1235 at $1236, we are coming into this week with a bullish price momentum. However, the VC PMI also tells us that if we close below $1235, this bullish trend momentum would be negated to neutral. This is the second level or second protective stop that you can use to manage your positions for self-directed individuals.
If the market closes above $1235, the first target this week is the sell 1 (S1) level of $1247, and the second target is the sell 2 (S2) level at $1258.
"Use these levels to unload and take profits of your long positions and go neutral," MontesDeOca recommended based on the VC PMI.
If the market comes down below $1235, it would negate this bullish trend to neutral and a second close below $1235 would activate the extreme below the mean of the buy 1 (B1) level of $1224 to the buy 2 (B2) level of $1211.
"When the market trades at the B1 or B2 level, you have a 90% to 95% probability that a reversion will occur back up to the average or mean price," MontesDeOca explained. "When the price trades above the S1 or S2 level, there is a 90% to 95% probability that a reversion will occur and the price will revert back down to the mean."
Coming into next week, we have a specific structure based on the weekly data, calculating the supply and demand levels that you can use to trade very accurately for self-directed traders.
The VC PMI
The VC PMI analyzes more than 30 markets. The gold report above is just a hint about what the VC PMI can offer in providing structure to trade markets. We are developing a subscription service for the Seeking Alpha Marketplace, so keep your eyes out for when we launch it, soon. Also watch out later this week for a special report about the VC PMI applied to the E-mini S&P index.
Disclaimer
The information in the Early Bird Report was obtained from sources believed to be reliable, but we do not guarantee its accuracy. Neither the information nor any opinion expressed herein constitutes a solicitation of the purchase or sale of any futures or options contracts. It is for educational purposes only.
Disclosure: I am/we are long GLD, GDX, USLV.
I wrote this article myself, and it expresses my own opinions. I am not receiving compensation for it (other than from Seeking Alpha). I have no business relationship with any company whose stock is mentioned in this article.
Follow Scot Macdonald and get email alerts