Gold & Silver; Ending month with bearish reversal patterns
CLICK ON CHART TO ENLARGE
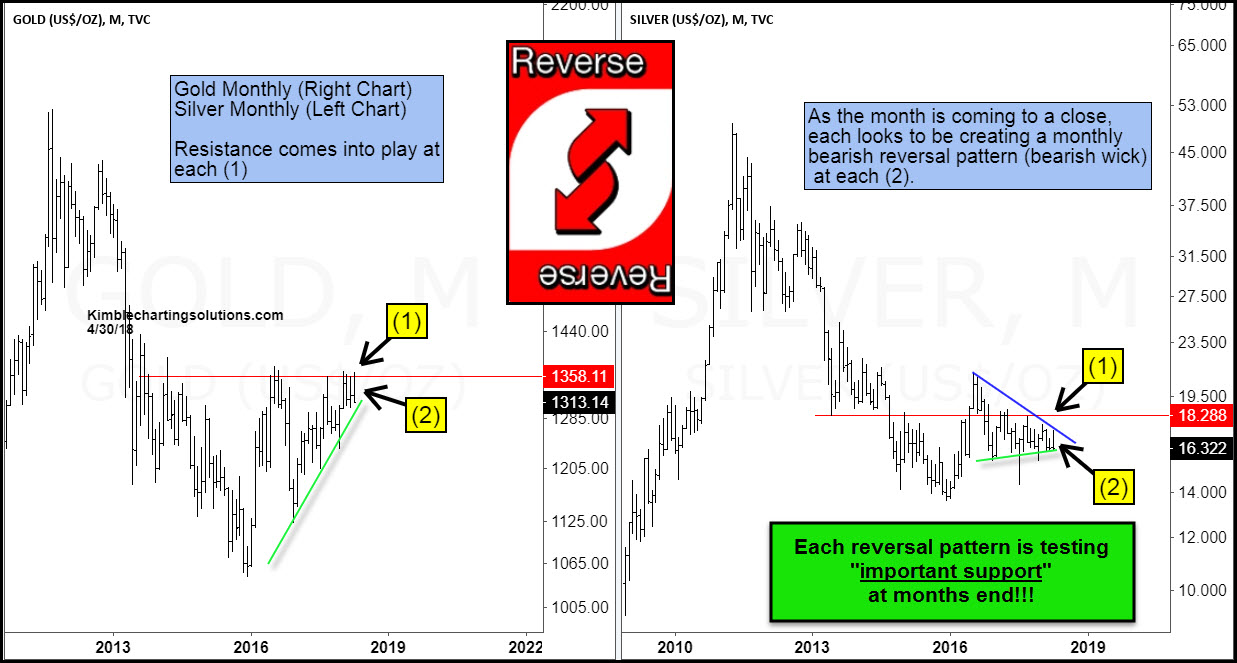
The 2-pack above looks at Gold & Silver on a "Monthly Basis" over the past 8-years. Both peaked in 2011 and have struggled to move higher ever since.
Overhead resistance comes into play for both at (1). During the month of April, both attempted to break above these important resistance lines, only to see buying pressure dry up and sellers step in. At months end, both could be creating bearish reversal patterns (bearish wicks) at each (2).
The softness by both this month has them testing support at each (2). As you can see, both are in a very tight spot, with very little wiggle room between resistance and support.
How each resolves this tight spot, could send be an indicator of a multi-month move going forward. Keep a close eye on how each handles this important support test, following this month's large reversal pattern just below resistance.
-