Gold And Dollar Diverge As Safe-Haven Bid Dissipates
Gold and the gold ETF break key levels as the safety bid reverses.
Dollar strength and lifting of the financial market panic are the culprits.
The longer-term gold recovery remains intact despite short-term pressures.
Almost as quickly as it began, gold's safe-haven bid was reversed on Tuesday as the broad U.S. equity market retraced an earlier decline and closed sharply higher to snap a 6-day losing streak. A key short-term price level was broken in the gold market, which we'll discuss here, while the U.S. dollar index came closer to confirming a short-term bottom. Here we'll look at the immediate technical developments in the gold market and discuss the prospects for gold's continued longer-term recovery.
Spot gold was 1 percent lower on Tuesday at $1,326, while April gold futures settled down 0.5 percent lower at $1,329. Spot silver dropped 0.9 percent to close at $16.59. It was a tumultuous day of trading as stock prices gyrated wildly while gold and other commodities suffered losses. Meanwhile, the dollar index continued to strengthen on Tuesday, which put additional downside pressure against the gold price.
Meanwhile the iShares Gold Trust ETF (IAU) closed under the $12.75 level on Tuesday, which stopped me out of my trading position in this tracking vehicle. As discussed in previous commentaries, I consider a violation of the $12.75 level in IAU to be pivotal to the near-term outlook and therefore a reason for exiting short-term trading positions. I'll be looking for another entry point once the market confirms that a bottom has been established following the latest decline.
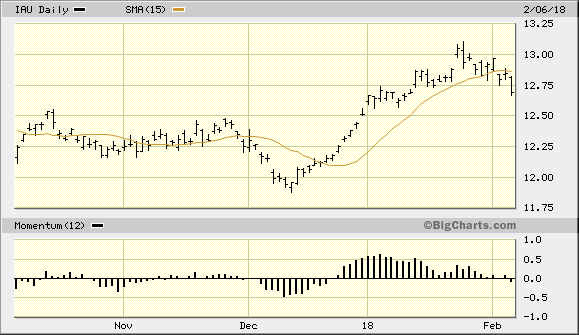
Source: www.BigCharts.com
In Tuesday's gold commentary we examined whether gold can rally alongside of a rising dollar index. In times of great market stress there have indeed been notable instances of this unusual occurrence. However, with the panic that gripped equity investors showing signs of lifting, the safe-haven bid for the gold price is also reversing. This was abundantly clear during the Feb. 6 trading session, when the S&P 500 Index (SPX) rallied to close 1.74% higher for the day while gold and silver were both lower in response.
The U.S. dollar index (DXY) continued to show signs of trying to reverse its multi-month downward trend. As shown in the following graph, the dollar index has been edging higher in the last three days and came within reach of its 15-day moving average on Tuesday. Even a slightly higher close from here would push the DXY price above the 15-day MA, which would serve as the first serious indication of a meaningful bottom being established in the dollar.
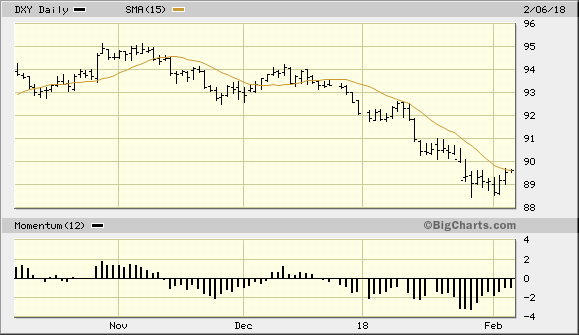
Source: www.BigCharts.com
Based on the rules of my technical trading discipline, a 2-day higher close above the 15-day moving average is required to confirm an immediate-term (1-4 week) bottom. If the dollar continues to strengthen from here and confirm an immediate-term bottom, the gold price would likely suffer for a while now that its safe-haven bid appears to have been reversed. At any rate, I don't recommend trying to anticipate when the selling pressure for gold will lift. We need to see a recovery both in the gold price and in the IAU price (see above chart) in which the price line for both recovers back above the 15-day moving average. As long as gold and the IAU remain below this important moving average, the sellers are assumed to have the advantage in the immediate term.
Another factor which is holding gold back in the immediate term is gold's relative strength versus the S&P 500 Index. We examined this in the previous commentary, and the latest relative strength reading is shown in the following graph.
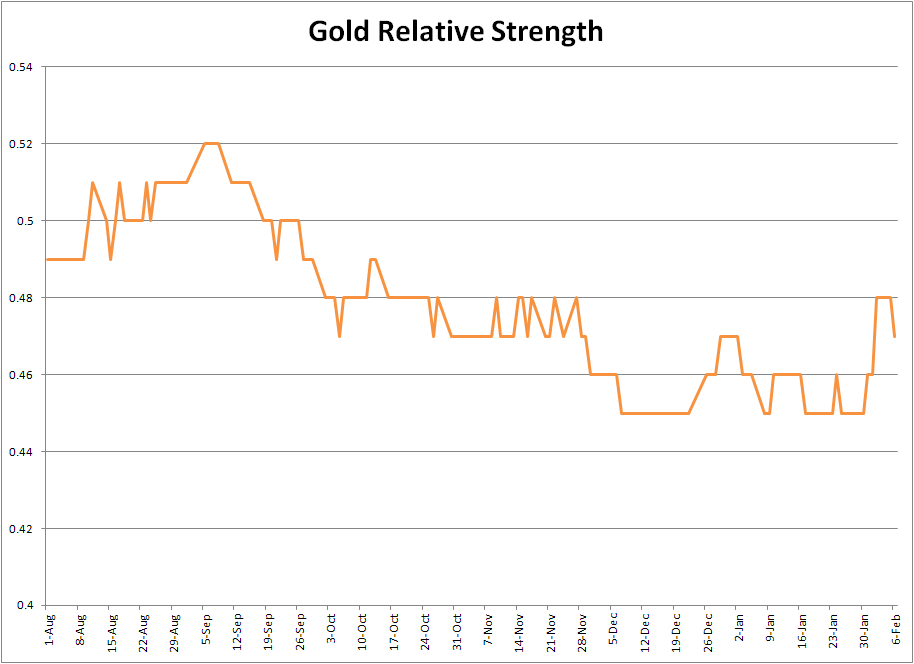
Chart created by Clif Droke
As previously mentioned, gold's relative strength against the stock market is an important indicator due to the fact that it's one of the things market-moving fund managers look at before making a commitment to the gold market. Significant and sustained improvement in gold's relative strength is therefore a necessary ingredient for attracting major money flows into gold.
I mentioned last time that gold's relative strength indicator should ideally rise above the 0.48 level to signify that gold demand versus equities has decisively increased. Unfortunately, the gold price decline and stock market rally on Feb. 6 caused gold's relative strength reading to pull back to 0.47. Thus the pattern of declining peaks visible in the above graph remains in place for now.
Gold's longer-term recovery is still on track to continue despite the latest setback, however. Shown here is the 5-year weekly chart for the gold price, which shows the progression of gold's recovery since December 2015. The stair-stepping pattern of higher lows in the metal's price in each of the last two years underscores the reversal of the gold bear market, which began in 2011. A gradual increase in the inflation rate is one of the major catalysts of this turnaround, and as gold is valued as a hedge against inflation its longer-term outlook remains bullish in view of the latest increase in wage inflation.
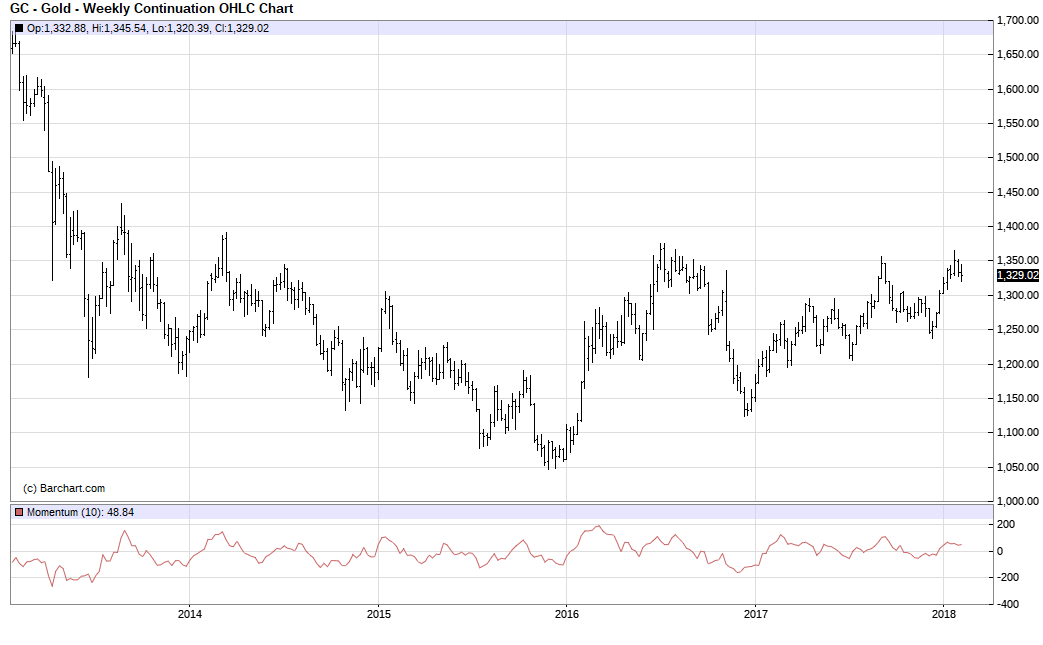
Source: www.Barchart.com
Accordingly, investors should maintain core long-term bullish positions in gold as the steady recovery of the gold price should continue in the year to come. I'm not recommending any new short-term trading positions in gold, however, until the above mentioned technical improvements become apparent. For disclosure purposes, I'm no longer in my long position in the iShares Gold Trust (IAU), which was established in December. In consequence of Tuesday's sell-off in IAU, I've honored my previously mentioned loss limit of $12.75 as this level was broken on a closing basis. No new trading positions in IAU are currently recommended.
Disclosure: I/we have no positions in any stocks mentioned, and no plans to initiate any positions within the next 72 hours.
I wrote this article myself, and it expresses my own opinions. I am not receiving compensation for it (other than from Seeking Alpha). I have no business relationship with any company whose stock is mentioned in this article.