Gold And Gold Miners - Their Runs Are Over
Gold price made an incredible run to break out of its one-year high of late.
The run is mostly due to the U.S. dollar's weakness. I'm still in the bull camp on the dollar's long-term prospects and believe that it will bounce back strong.
Gold and gold miner charts showed that their pullbacks will be imminent.
This idea was discussed in more depth with members of my private investing community, Momentum Play.
I turned into a long-term gold bull once the Fed increased its fund interest rate for the first time in December 2015. In the article published back in 2016, I said that:
History has shown that gold price and Fed fund interest rate are in positive correlation most of the times.
The only time they are in opposite direction is when gold up and Fed fund interest rate down
Gold together with gold miner ETFs VanEck Vectors Gold Miners ETF (GDX) and VanEck Vectors Junior Gold Miners ETF (GDXJ) all made another incredible run recently after the Fed increased its fund interest rate again last month. Gold's recent run is directly linked to U.S. dollar weakness. It dropped below $90, a key psychological support level, last week and many believe that the U.S. dollar downtrend will continue. Seeking Alpha author HFIR even claimed in a recent article that the multiyear U.S. dollar downtrend has just started. HFIR showed a 40-year U.S. dollar chart to support this bearish view.
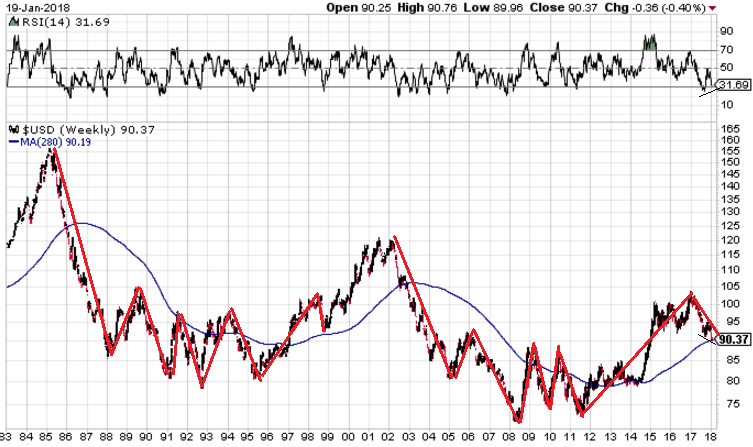
But I have a totally different interpretation of the same chart, and believe that recent U.S. dollar weakness is just a pullback in a long-term U.S. dollar bull run. Below is the weekly U.S. dollar chart during the last 35 years:
Source: StockCharts.com
The above chart shows that the U.S. dollar's trend from 2002 to today mimics its chart pattern from 1985 to 1998. First there was a big drop, then it bounced back and followed to form a W-shaped move, pulled back again and formed a triple bottom, made a breakout move, and was followed by another smaller pullback. If history repeats itself, we will see the end of the pullback and resume its run. So far, the pattern matches perfectly.
In addition, the booming U.S. economy does not support a weak U.S. dollar. It's our belief that the U.S. dollar's recent breakdown will be a fake one, and it should return to above $90 level soon.
Now let's turn our attention to the short-term trend for gold, gold miners, and the U.S. dollar.
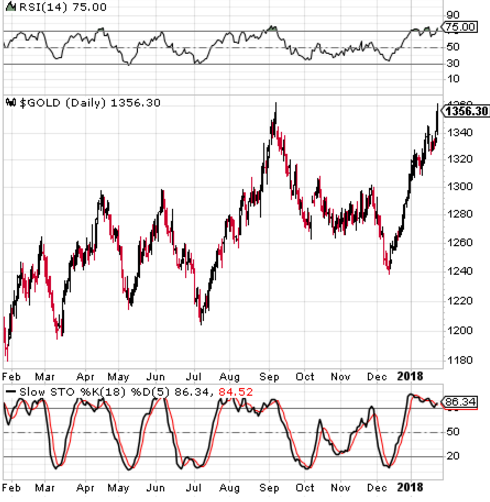
First, gold:
Source: StockCharts.com
The SPDR Gold Trust ETF (GLD) presents a similar chart. Since bottoming on Dec. 12, 2017, gold made an approximately 120-point run. During the process, it first had an unstoppable run and then followed the pattern of a pullback, with a strong bounce twice recently -- the typical bull pattern of higher lows and higher highs. Most believe that nothing can stop its bull run and that we could even see a repeat of bitcoin's 2017 run.
But the technical picture tells a different story. Its RSI is forming a triple-top formation. Its STO showed a divergence move: While the gold price makes a higher highs move, its STO gives us a lower highs pattern. If this isn't very obvious, the two gold miner ETFs tell the story more clearly.
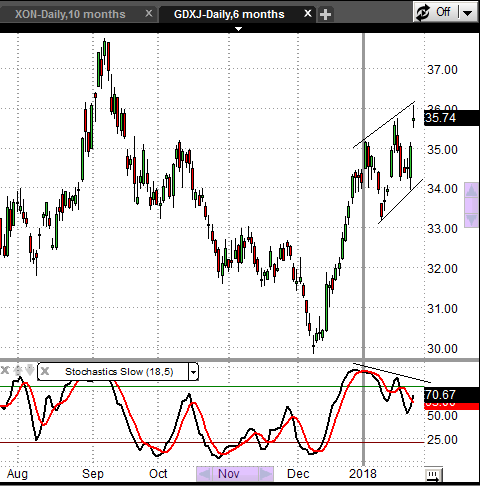
GDXJ: The chart below made a clearer picture of the divergence between the price and its technicals:
Source: StockCharts.com
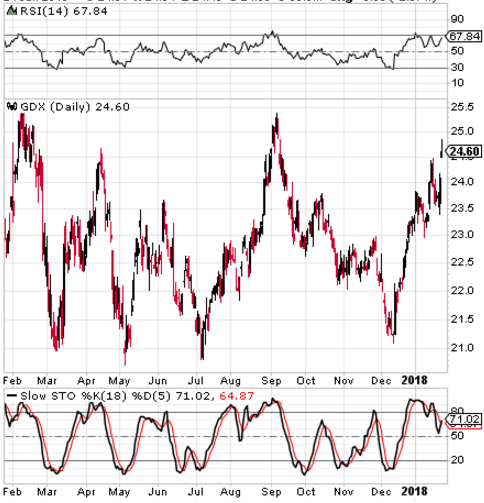
GDX: Its RSI also showed a possible triple top. STO's drop becomes more severe while its price jumped to a new recent high.
Source: StockCharts.com
The U.S. dollar was at $89.23, bouncing from $88.25.
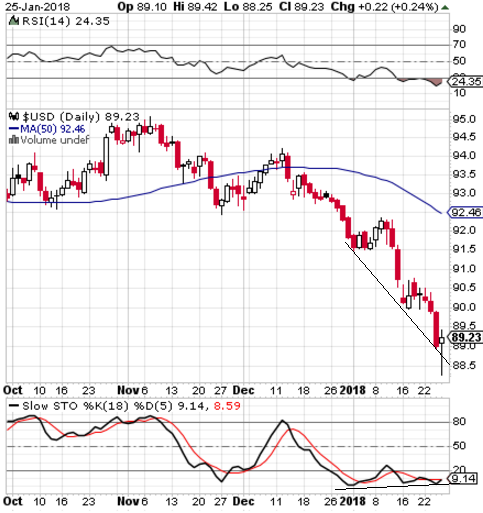
Source: StockCharts.com
The chart above showed that while the U.S. dollar had big declines, its technical picture improved as the STO indicator did not move lower after making a year low in last December. It also showed the huge gap between its 50-day MA and its price.
It remains to be seen whether we will see a short-term pullback for the gold and gold miners, as we have seen recently, or a longer-term trend reversal. For me, I am more in the trend-reversal camp. I am a true believer of "three strikes and you're out." Of course, the so-called trend reversal is also a short-term thing, meaning that the following gold pullback could be much longer than just two to three days.
If you feel this article is helpful, please click the "Follow" button and more timely updates will send to you quickly. Also, please check out my Marketplace service, Momentum Play, by clicking here.
Disclosure: I am/we are long JDST.
I wrote this article myself, and it expresses my own opinions. I am not receiving compensation for it (other than from Seeking Alpha). I have no business relationship with any company whose stock is mentioned in this article.