Gold Mining Shares At Important Juncture
Gold rally hasn't had a specific catalyst, but a variety of factors.
Not the least of these has been its value relative to equities.
Gold mining stocks may need "consolidative pause" before continuing higher.
Whenever the price of a widely watched asset like gold is trending higher, financial writers invariably struggle to discover the rally's underlying cause. They'll usually point to a provocative news headline or a dominant concern among investors, such as inflation or some military threat. And while sometimes these can be legitimate drivers of a gold rally, there are times when gold prices rise for no one specific reason. As we'll discuss here, this is one of those times when gold rose without a singular specific catalyst, but a confluence of factors. I'll also explain why the gold mining shares are leading indicators for the gold price and are approaching an important juncture.
Contrary to popular belief, gold doesn't always require a fear-related catalyst in order to rally. Sometimes the concentrated force of a few big-money buyers is sufficient to create an upward bias for the gold price, even without the benefit of investor fear. When smaller retail investors lose interest in gold, as what happened late in 2017, money managers will often take a contrarian stake in the metal. If participation in the gold futures market is light enough, this concerted buying activity is often sufficient to ignite a technical rally.
A technically driven rally once begun can eventually attract enough attention to fuel an extended rise of the price line, especially if the market isn't overcrowded with competing interests. Ever since the gold rally commenced in early December, gold has essentially been a one-way trade with little conflict from the bears and expansive buying interest from managed money. This partly explains the low-volatility extended rally of the gold price in the last five weeks.
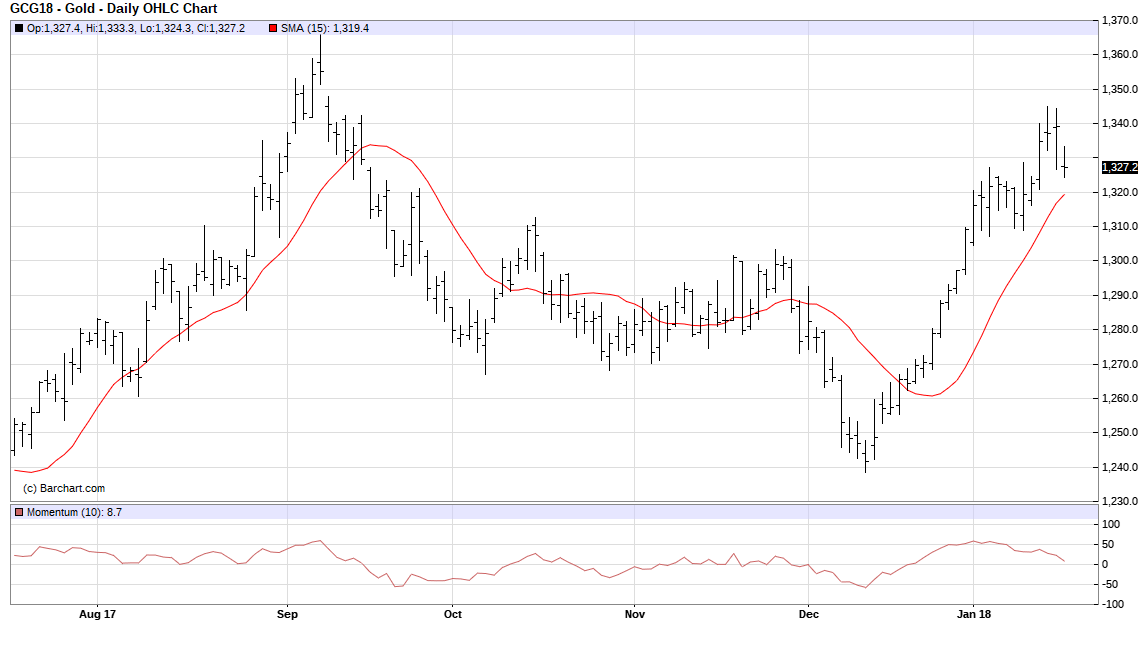
Source: www.Barchart.com
Value-oriented investors also were drawn to gold after its steep sell-off from September to December. With equities considered by many participants to be richly priced, gold and gold mining shares offered an attractive bargain by comparison. Indeed, the relative value of the gold mining stocks is one of the features which have served to attract the interest of serious investors in recent weeks, as we'll discuss here.
Turning our attention to the mining stocks, the VanEck Vectors Gold Mining ETF (GDX) is my favorite proxy for the actively traded gold stocks as a group. GDX confirmed an immediate-term buy signal per the rules of my technical trading discipline in earlier December after closing two days higher above its 15-day moving average. Since then I've relied on the 15-day MA to serve as a stop-loss guide as well as to confirm the integrity of the immediate-term (1-4 week) uptrend. As long as GDX remains above its 15-day MA on a closing basis, the immediate trend for the gold stocks as a group is assumed to be bullish.
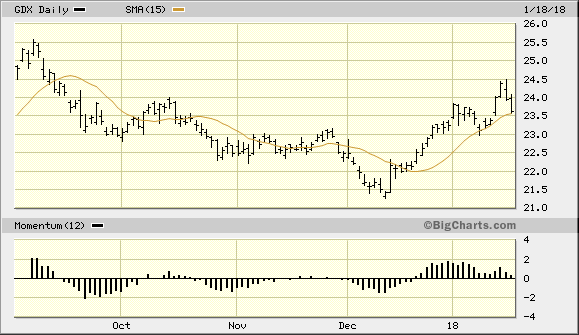
Source: www.BigCharts.com
However, a close under the 15-day MA on a weekly basis would serve as a caution signal on the immediate-term trend. It wouldn't by itself serve as a sell signal for the mining stocks, but would be a cause for increasing our caution going forward - especially given how little leeway the actively traded gold stocks have between their current prices and the December lows. My favorite indicator for measuring the internal momentum of the gold stocks as a group is the rate of change of the 10-week new highs and lows of the 50 most actively traded mining shares (see below).
Shown here is a graph of the two key components of this indicator. The blue line represents the short-term directional component, i.e. the four-week rate of change (R.O.C.) of the new highs-lows. The red line signifies the intermediate-term directional component, i.e. the 18-week rate of change. As can be seen here, the indicators are at cross purposes right now with the short-term indicator still in a rising trend while the intermediate-term component is in a declining trend. For much of the last several weeks, the directional (four-week R.O.C.) was the primary determinant of the broad gold stock market rally. But with this indicator showing signs of possibly topping out, the intermediate-term indicator (red line) is beginning to make its influence felt on many of the major gold mining shares.
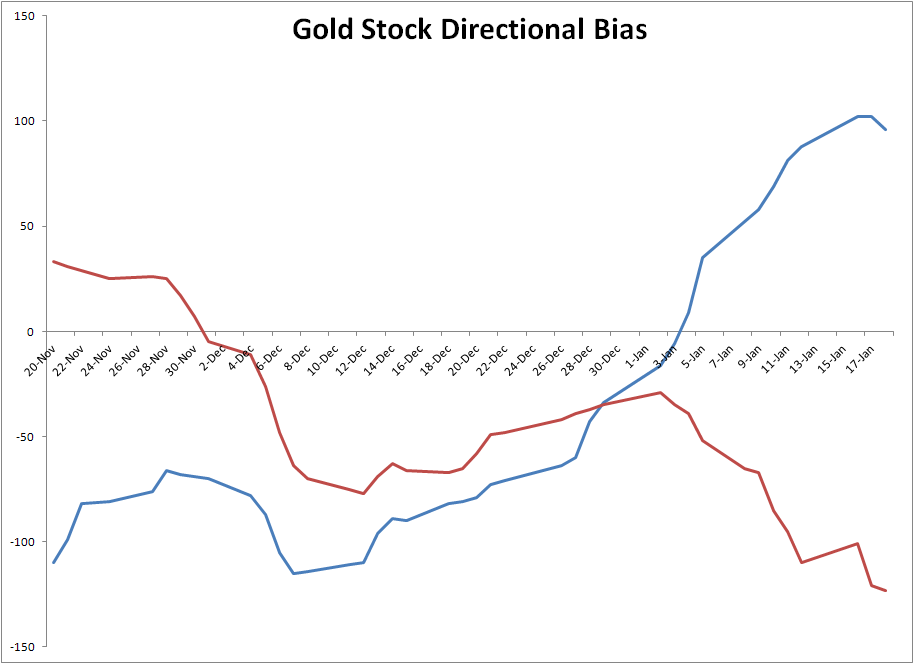
Chart created by Clif Droke
For disclosure purposes, I'm currently long iShares Gold Trust ETF (IAU), my favorite proxy for the gold price. After taking some profit earlier this month once the $12.75-$12.80 area was reached, I've since recommended that traders raise stop losses on the remaining part of this trading position. Currently the stop-loss should be raised to slightly under the $12.65 level (closing basis) where the 15-day moving average is found in the daily chart. I also recommend raising the stop loss on existing long positions to slightly under the $1,321 level in February gold, which is where the 15-day moving average is currently found in gold's daily chart. I also recommend using a level slightly under the $23.50 level as the stop-loss on a closing basis for GDX, which I am also currently long.
The most likely outcome of the above mentioned cross-current between short-term and intermediate-term internal momentum among the actively traded mining stocks is a sideways, trading range-type market environment. A brief period of lateral consolidation would actually be desirable, and may in fact be necessary, before GDX and the rest of the mining shares are ready to resume the upward trend begun in December. Since the physical gold market is in such good shape, the gold mining shares are likely to continue that upward path, and the internal momentum underlying the gold stocks should eventually become re-synchronized to the upside. For now, though, it would be a good idea for traders to raise stop losses on existing long positions among the gold shares and keep a close eye on the laggards within the group.
Disclosure: I am/we are long IAU, GDX.
I wrote this article myself, and it expresses my own opinions. I am not receiving compensation for it (other than from Seeking Alpha). I have no business relationship with any company whose stock is mentioned in this article.