Gold Reacts To The Fed
Gold enters December in reasonable shape.
The price holds $1200 despite new highs in the dollar index.
The Fed Chairman gives a speech that is bullish for the yellow metal.
The low came early in 2018; open interest tells us no one expects a significant move.
Golden prospects for 2018 - NUGT will magnify results on a rally.
Nearby February gold futures on the COMEX division of the CME settled at the $1227.80 per ounce level on Friday, November 30. On Tuesday, December 4, it traded to a high at $1247.50. The low for the year on the active month contract was at $1173.20 on August 16, but the continuous contract bottom was at $1161.40 per ounce.
Gold is head into the final month of the year at a level that was more than $54 per ounce above this year's low, bit it is crawling higher at the start of December.
If the price pattern of the past three years repeats, the yellow metal could be in for a bumpy road and lots of selling over the coming weeks. December was not a good month for the gold market in 2015, 2016, and 2017. However, each year is always a new adventure in markets, and past performance is never a guaranty of future results.
As we head into the final weeks of 2018, there are signs that gold may be poised to rally from its current price. On the first trading session of December on Monday, the price of the precious metal moved to the upside. Gold and gold mining shares are above their lows for 2018, but they are a lot further from the highs at the start of this month. Gold mining shares tend to magnify the price action in the gold market, and the GDX and GDXJ ETF products represent the share prices of the leading and junior producers of gold respectively. When it comes to speculative positions, the gold mining shares often provide market participants with more substantial gains or losses on a percentage basis. These days, financial engineering and a seemingly endless choice of products are available to traders and investors that always seek to employ the perfect tool for each opportunity. Anyone who does work around the house knows that the perfect tool leads to an ideal result. For those looking for a move in the gold market over the coming days and weeks, the NUGT and DUST triple leveraged ETF products will not only magnify results in the gold market, but they also apply leverage to the GDX and GDXJ instruments. While gold is an effective hedging weapon on a historical basis when it rallies, NUGT can be a bazooka when the price of the yellow metal moves to the upside.
Gold enters December in reasonable shape
The price of gold has had an upward trajectory since the mid-August low at $1173.20 per ounce. 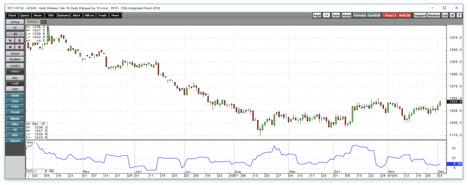
Source: CQG
As the daily chart of February COMEX gold futures highlights, the precious metal has been making higher lows since the summer, but it has been in a trading range from $1202.40 to $1252.00 since mid-October. At $1247.50 on December 4, gold was $74.30 above the August bottom and only $4.50 below the October 26 peak. Daily historical volatility is at the 6.98% level which tells us that the price action to the upside has been slow and steady in the gold market. The metric that measures price variance tends to move higher during price corrections to the downside.
The price holds $1200 despite new highs in the dollar index
Perhaps the most significant factor that took gold to the lows in August was the bullish price action in the dollar index. 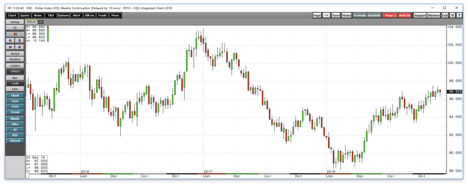
Source: CQG
As the weekly chart of the dollar index futures contract shows, the greenback reached 96.865 in mid-August. The historical inverse relationship between the dollar and gold took the price of the yellow metal to lows at the same time the dollar hit a peak. However, the dollar index recently rose to a higher high at 97.53 in mid-November. 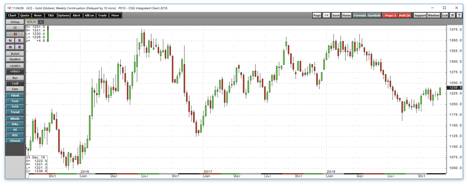
Source: CQG
The weekly gold chart shows that when the dollar made its mid-November high, gold moved lower, but it only reached a bottom at $1196.60 per ounce, $35.20 above the price when the dollar reached its previous peak which was lower than the mid-November high for the dollar index.
The price of gold only probed below the $1200 briefly, and while the dollar index backed off from the 97.53 level, it has remained near that high while the price of gold has been climbing. When a market should move lower on the back of a historical relationship, and it does not, it is often a sign of underlying strength.
The Fed Chairman gives a speech that is bullish for the yellow metal
February gold had been trading in a range from $1213.30 to $1236.70 since the most recent peak in the dollar index, but this week the price moved to a higher high at $1247.50 on the back of two factors. Last week, the Chairman of the U.S. Federal Reserve Jerome Powell seemed to have backed off from his hawkish approach to monetary policy when he told the Economic Club of New York that the Fed Funds rate is a little below neutral which was a departure from a recent comment that it was far behind the neutral level. The subtle changed caused the stock market to rally and the dollar to stop in its tracks before it could move to a new and higher high. On Monday, the dollar reacted to the growing optimism over a trade deal between the U.S. and China. The Chinese government had slashed domestic interest rates as a tool in the trade dispute which provided support for the U.S. dollar. However, a settlement or deal could take some of the upward pressure off the U.S. currency as the Chinese will not need to continue to slash their rates. Gold rallied to a new high on Tuesday, December 4 which was less than $5 below the October 26 peak at $1252 and the area of technical resistance for the yellow metal.
The moment of truth for gold will arrive on December 19 when the Fed announces its next rate hike and guidance for 2019. Over recent years, the lead up to the final Fed meeting of the year has caused lots of selling in the gold market.
The low came early in 2018 - open interest tells us no one expects a significant move
December has not been a good month for anyone holding a long position in the gold market over the past three years. 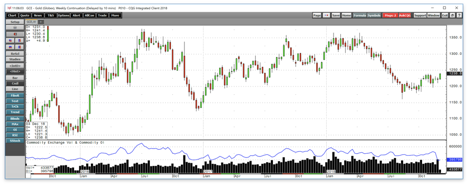
Source: CQG
The weekly chart illustrates that gold found a bottom in December 2015 at $1046.20 per ounce. In 2016, the yellow metal fell to a low in December at $1123.90, and last year, selling during the final month of the year took the price of gold to a low of $1236.50 per ounce. The price of gold has declined in December for three consecutive years, and the Fed has increased the Fed Funds rate at their final meeting of the year in December for three straight years. Higher interest rates in the U.S. are supportive of the dollar, and they increase the cost of carrying inventories and long positions in all commodities market. When it comes to gold, higher short-term rates cause the contango or forward premium in the gold market to rise.
It is more than likely and almost certain that the FOMC will increase the Fed Funds rate by 25 basis points at their December meeting, no matter how much it gets under the skin of President Trump. The market currently expects the move after months of guidance. However, the devil will be in the details when it comes to the December meeting, and a less hawkish approach by the central bank to monetary policy moves in 2019 will overshadow a 25-basis point move in the Fed Funds rate. In his speech last week, Chairman Powell may have given the market a window into his thinking that four rate hikes in 2018 will lead to a more gradual and less hawkish approach to tightening credit in 2019. If that is the case, the relief in the market could lead the dollar to decline, and gold to move to the upside. Gold is sitting at a level where the market is taking cover in case it suffers as it had during the final months of the past three years. As the weekly chart shows, the open interest metric which represents the total number of open long and short positions in the COMEX futures market declined from 528,149 contracts during the week of the most recent low in gold to 395,798 contracts as of December 3 While the decline of 132,351 contracts or 25% is typically not a bullish sign for a futures market when it is undergoing an upside correction, it is a sign that market participants have taken cover and exited positions as the futures contract rolled from December to February over recent sessions.
With many market participants moving to the sidelines in the gold market over recent sessions, it is likely that sentiment is pointing to a repeat of the past three years at some point in December or little or no upside action. In the world of commodities, significant moves often occur when the market least expects. The low came early in 2018 when gold traded down to just over the $1160 level on the continuous futures contract a move below that level from the current price would likely come from a spike to the downside.
Golden prospects for 2018 - NUGT will magnify results on a rally
We will find out over the coming weeks if gold is going to make December 2018 the fourth consecutive year of selling in gold during the final month of the year. The stage is set for a move to the downside with the Fed ready to hike the Fed Funds rate, and the dollar near its high for the year, and a history of seasonal price weakness. However, the price action in the gold market since August has been anything but bearish.
A selloff in gold would not surprise many market participants given all of the factors that surround the yellow metal, but a rally could cause a bit of shock and awe. In markets, the most significant moves tend to come from price levels where the majority of market participants are looking the other way. These days, a contrarian approach to gold involves the long side of the market. For those of us daring enough to take on a long position in gold in the face of many bearish factors and a price that refuses to move lower, the Direxion Daily Gold Miners Bull 3X ETF product (NUGT) creates a long position on steroids. The fund summary for NUGT states:
The investment seeks daily investment results, before fees and expenses, of 300% of the daily performance of the NYSE Arca Gold Miners Index. The fund invests at least 80% of its net assets (plus borrowing for investment purposes) in securities of the index, ETFs that track the index and other financial instruments that provide daily leveraged exposure to the index or ETFs that track the index. The index is a modified market capitalization weighted index comprised of publicly traded companies that operate globally in both developed and emerging markets, and are involved primarily in mining for gold and, in mining for silver. It is non-diversified.
The fund summary for DUST is similar but the inverse as it replicates a 300% bearish result. Both NUGT and DUST provide triple-leverage on the long and short sides of the market in gold mining stocks. The price for leverage is time decay, so both products suffer from reverse splits, and their values decline dramatically over time. Therefore, NUGT and DUST are only appropriate for long and short positions in the gold mining stocks on a very short-term basis. Meanwhile, both products can be explosive when the market moves in the direction where you place your chips in the gold market. As an example, the price of February gold moved from a low of $1216.80 on November 28 to a high of $1247.50 on December 4, a rise of 2.52% over the period. 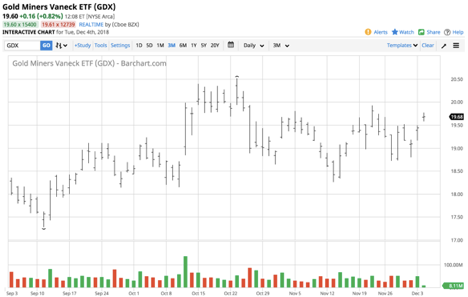
Source: Barchart
Over the same period, GDX moved from $18.73 to $19.77 a rise of 5.55%, which magnified the price action in the gold market. 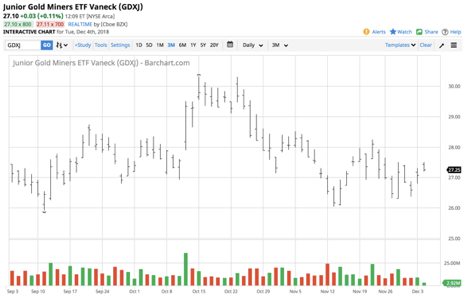
Source: Barchart
GDXJ moved from $26.32 to $27.50, or 4.48% higher, which is a divergence because, over time, the junior gold mining product tends to magnify the price action in the GDX. 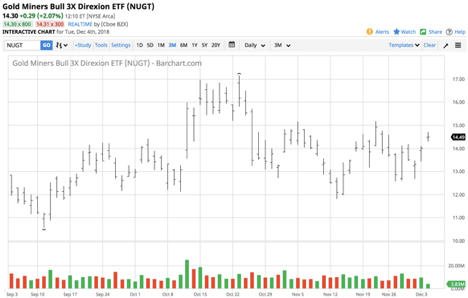
Source: Barchart
Meanwhile, over the same period, NUGT moved from $12.60 to $14.70 or 16.67% higher. NUGT moves more than gold futures, GDX, or GDXJ on a percentage basis when the gold market is in bullish mode. On the downside, DUST provides similar results when the price of the yellow metal is falling.
The most significant warning when it comes to the danger of NUGT and DUST is the levels they traded to on their highs. NUGT was trading at $14.30 on December 4. In 2011 the all-time peak was at $17,460.00 per share. DUST was at $30.65 on December 4, and the all-time peak at $4,162.50 in June 2013. These instruments can enhance trading and investing as they are explosive when it comes to short-term moves on a percentage basis. However, the value will implode in your portfolio once they begin to collect dust and sit in an account for more than a few weeks.
We are now in December, which has been a very challenging time in the gold market. The most significant moves often occur when no one is looking or expecting. A break to the upside in the gold market thus month would shock the market, so the risk-reward on the upside these days may be worth the bet.
The Hecht Commodity Report is the most comprehensive commodities reports available today from the top-ranked ranked author in both commodities, forex, and precious metals. My weekly report covers the market movements of over 25 different commodities and provides bullish, bearish and neutral calls; directional trading recommendations, and actionable ideas for traders and investors.
For the next two weeks, I am offering a one-time sale price. Anyone who signs up for a one-year subscription will receive a 30% discount ($490 per year) off the current rate and will never experience an increase as long as they remain a subscriber.
Disclosure: I/we have no positions in any stocks mentioned, and no plans to initiate any positions within the next 72 hours.
I wrote this article myself, and it expresses my own opinions. I am not receiving compensation for it (other than from Seeking Alpha). I have no business relationship with any company whose stock is mentioned in this article.
Additional disclosure: The author always has positions in commodities markets in futures, options, ETF/ETN products, and commodity equities. These long and short positions tend to change on an intraday basis.
Follow Andrew Hecht and get email alerts