Gold Weekly: Is It A Safe-Haven, Seriously?
Gold does not capture any safe-haven bids.
Speculators turn bearish on gold for the first time in seven weeks, the CFTC shows.
ETF investors cut their gold holdings for the first time in three weeks, according to FastMarkets' estimates.
Gold is not dead, but its macro backdrop is not as friendly as one would expect, for now.
I am long IAU over the long term (12m). I am sorry, but I don't pay attention to the noise of the market.

Introduction
Welcome to my Gold Weekly.
In this report, I wish to discuss mainly my views about the gold market.
To do so, I analyse the recent changes in net speculative positions on the Comex (based on) and ETF holdings (based on FastMarkets' estimates) and draw some interpretations about investor and speculator behavior. I conclude the report by sharing my trading positioning.
While the CFTC statistics are public and free, the data about gold ETF holdings are from FastMarkets, an independent metals agency which tracks ETF holdings across the precious metals complex.
Speculative positioning
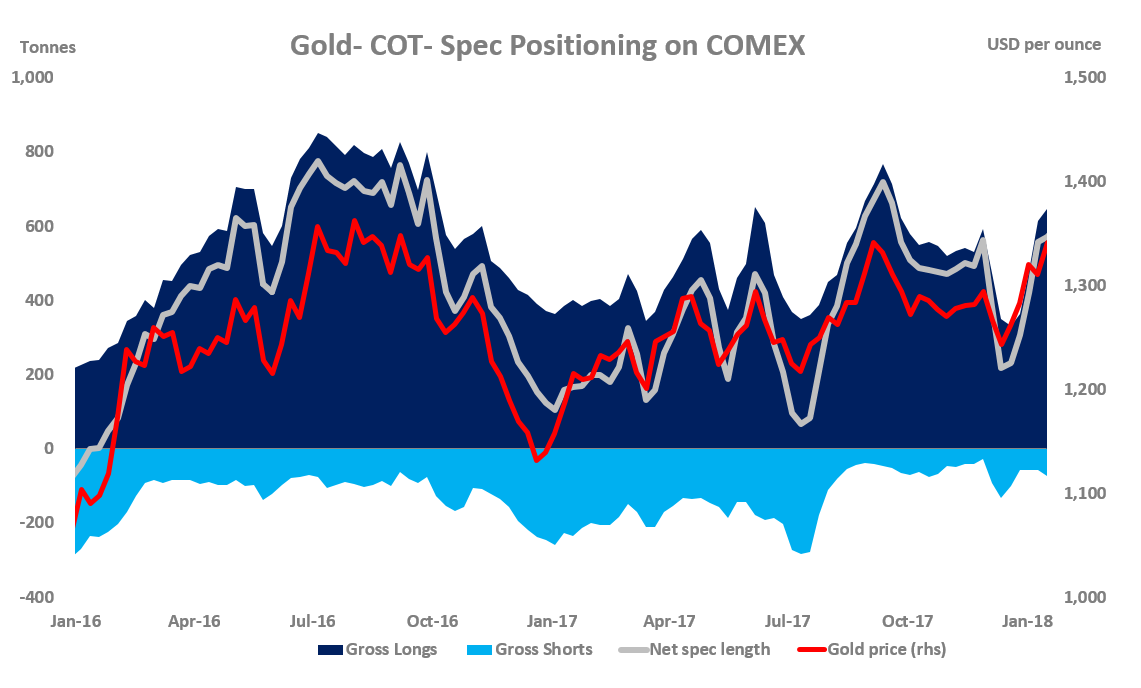
Source: CFTC
According to the latest Commitment of Traders report (COTR) provided by the CFTC, money managers cut slightly their net long position for the first time in seven weeks over the reporting period (January 23-30) while spot gold prices edged 0.2% lower from $1,342 per oz to $1,339 over the corresponding period.
The net long fund position - at 588.43 tonnes as of January 30 - dropped 5.60 tonnes or 1% from the previous week (w/w). This was driven exclusively by long liquidation (for the first time in six weeks) of 15.33 tonnes, while shorts cut their exposure (for the first time in three weeks) by 9.73 tonnes.
The net long fund position remains up by a substantial 282.94 tonnes or 93% since the start of the year after rising 182.55 tonnes or 149% in the whole of 2017.
Gold's spec positioning is quite long, with its net spec length at 76% of its historical record.
Investment positioning
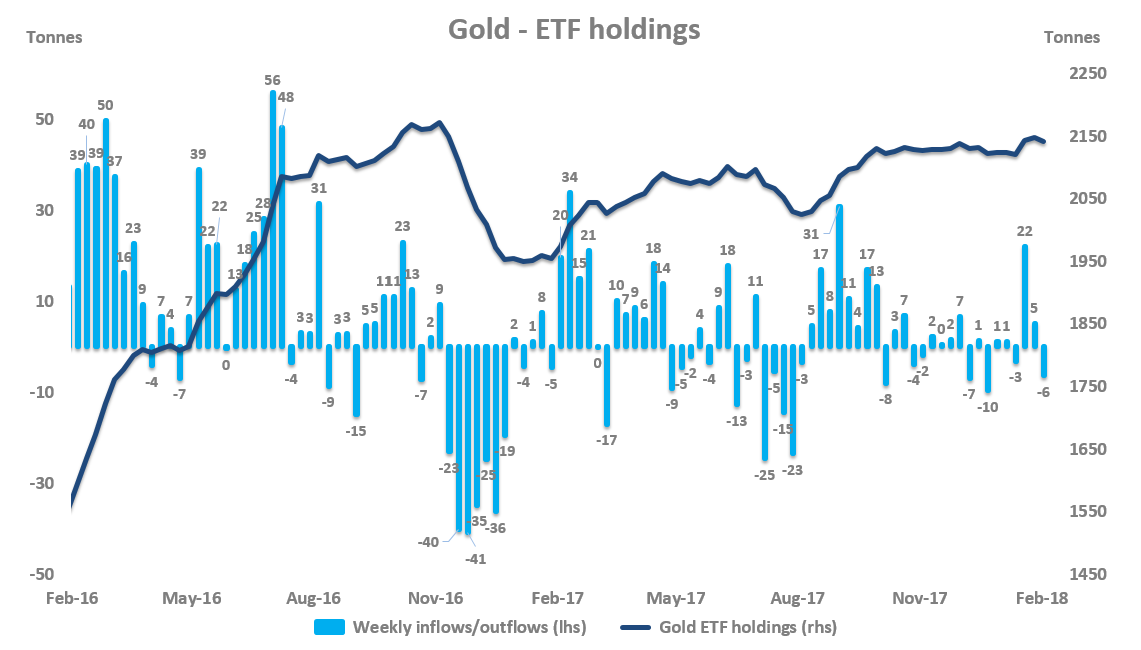
Source: FastMarkets
ETF investors sold 6.39 tonnes of gold over January 26-February 2, while spot gold prices were unchanged at $1,349 per oz over the corresponding period. This marked the 1st week of net outflows in three weeks.
Outflows from gold ETFs were concentrated on Wednesday, January 31, totaling 4.12 tonnes, marking the largest daily net outflow since December 18, 2017 (-9.63 tonnes), according to FastMarkets' estimates.
The largest part of last week's outflows came from the SPDR GLD ETF (-6.79 tonnes), which was in part counterbalanced by net inflows of 3.31 tonnes into the iShares Gold Trust ETF (IAU).
Despite the recent surge in outflows from gold ETFs, ETF investors remain net buyers of 18.90 tonnes since the start of the year, which corresponds to an increase of ~1% in total gold ETFs.
In the whole of 2017, ETF investors were net buyers of 173.38 tonnes of gold, which represents an increase of 8.8% in gold ETF holdings.
As of February 2, 2018, gold ETF holdings totaled 2,142 tonnes, according to FastMarkets' estimates.
Macro backdrop for gold
In spite of the substantial increase in volatility since the start of February (CBOE VIX as a proxy, which is up a massive 180% in the month to date at the time of writing, the largest monthly rise on records), gold's performance (IAU as a proxy) has proven to be subdued. Let me illustrate this point with the following two monthly charts.
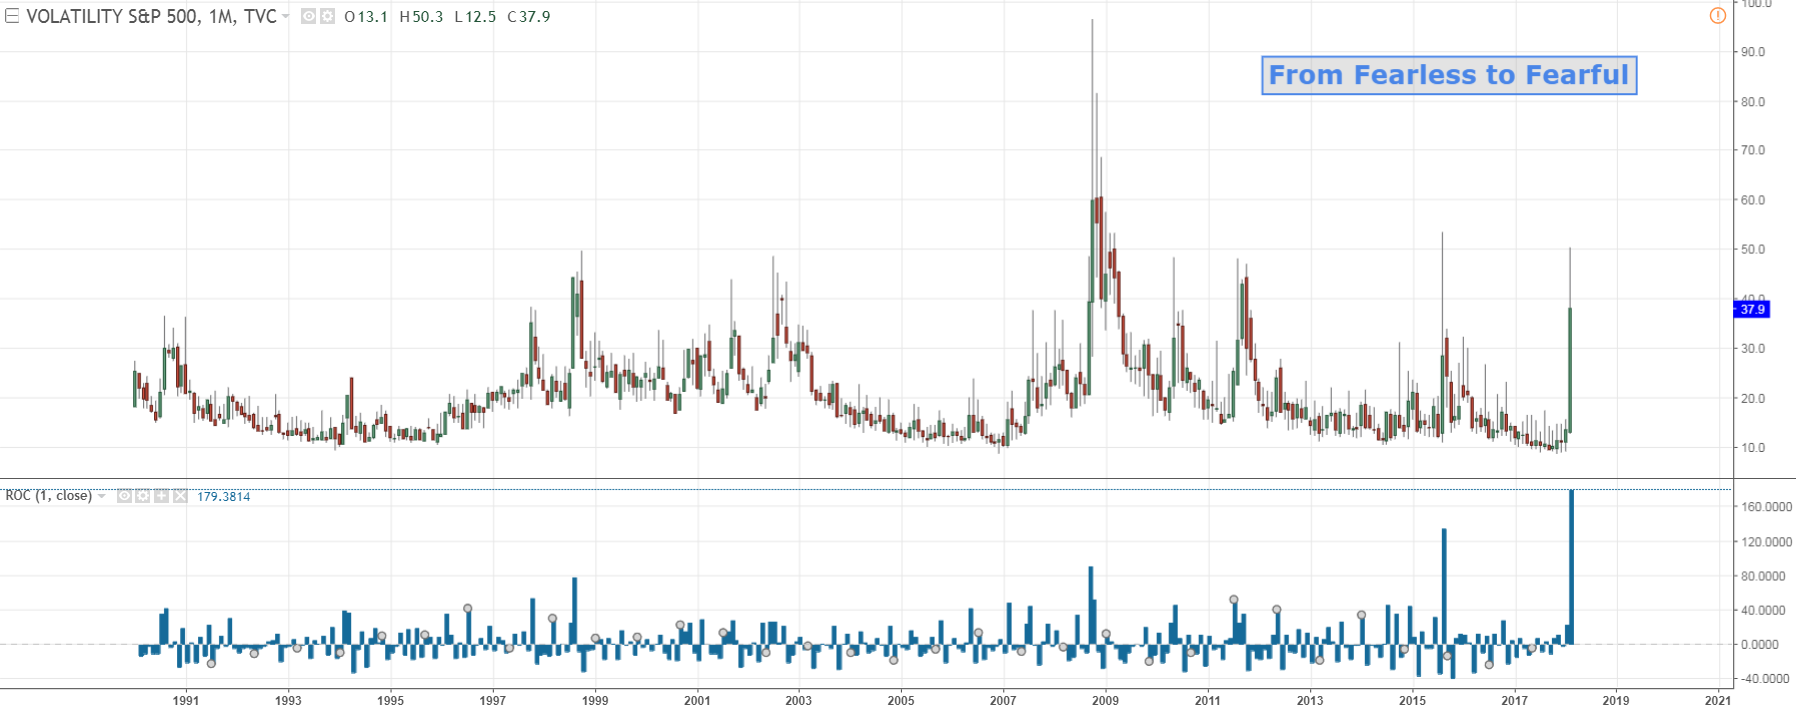
Source: Trading View
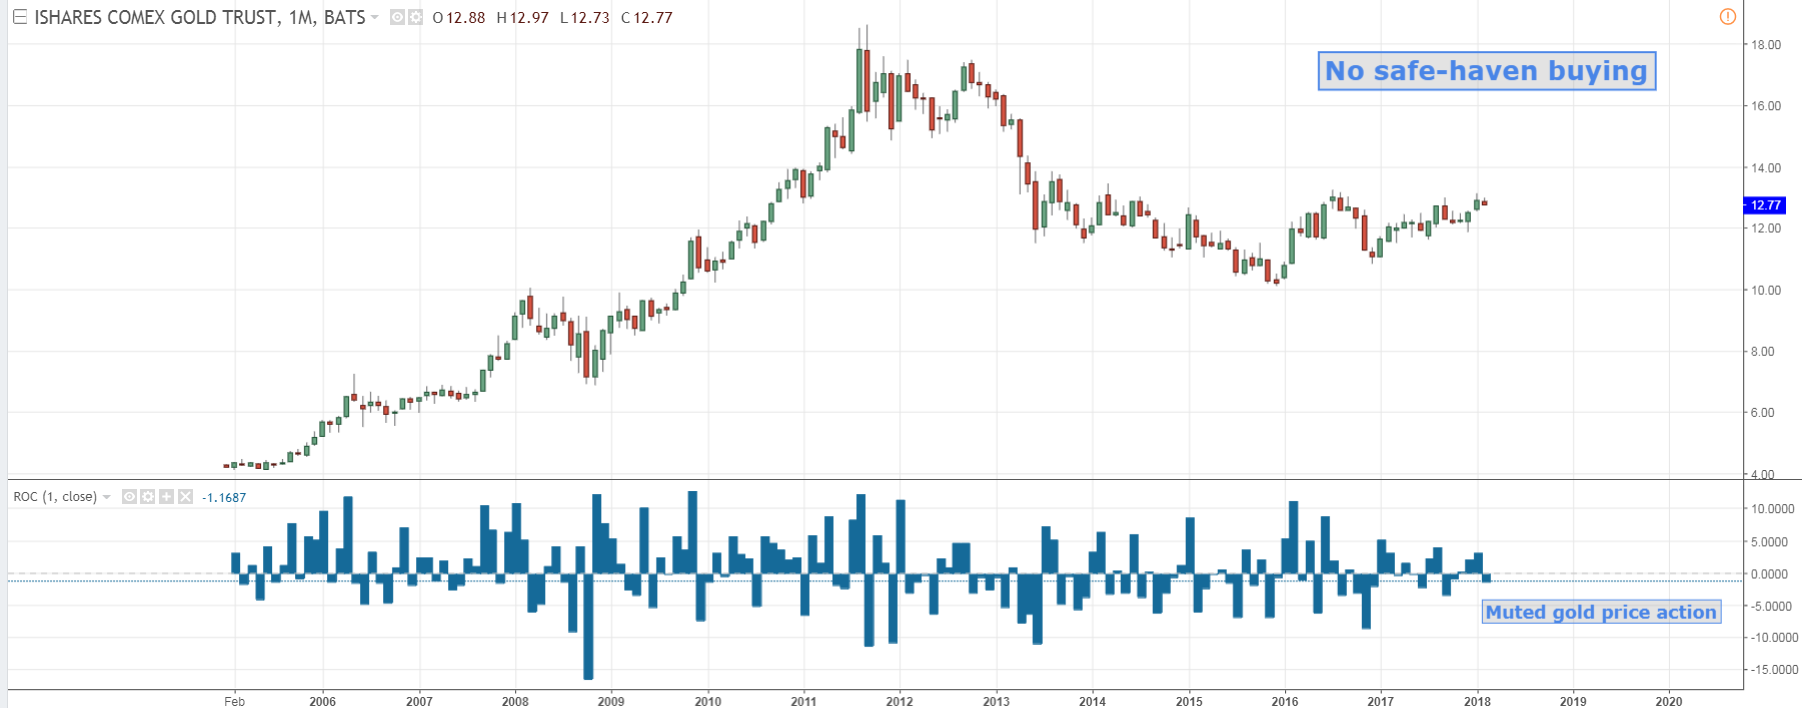
Source: Trading View
At a first glance, it seems that we live in two different worlds: one world in panic (where the VIX is on steroids) and one in peace (where investors do not feel the need to boost their risk-unfriendly positions).
But digging a bit deeper, it is important to realize that the correlation between gold and VIX is not as strong and stable as one would intuitively expect.
In fact, gold's function reaction can be modeled with two key parameters: the dollar (DXY as a proxy) and US real rates (10-year US TIPS yield as a proxy). Those two macro variables are negatively correlated with gold.
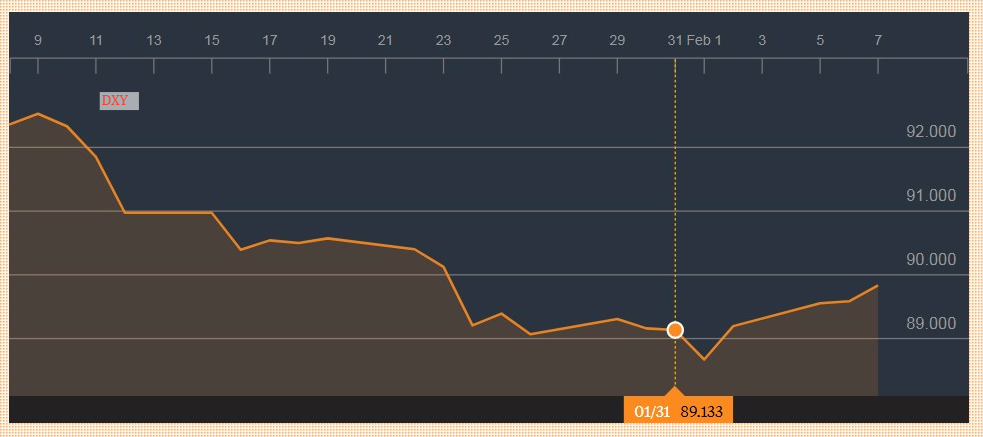
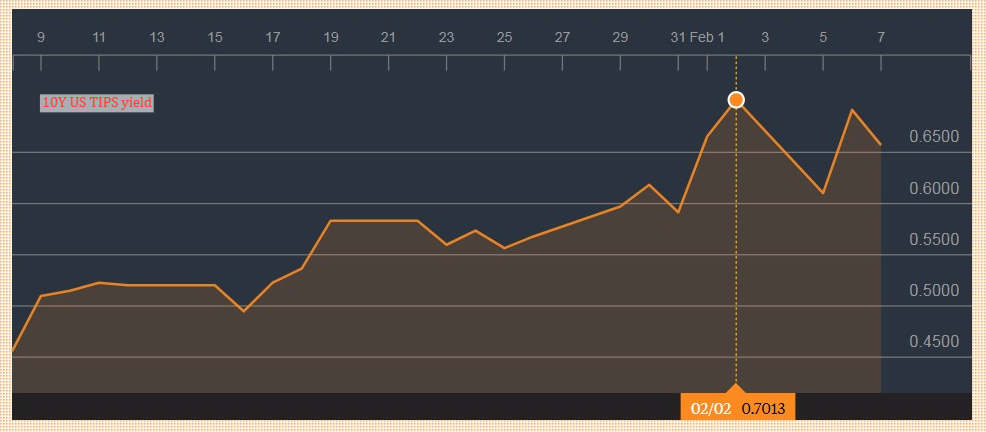
Source: Bloomberg
As you can see below, the dollar and the 10-year US TIPS yield have not experienced strong moves since the start of February, in sharp contrast with the surge in VIX.
The macro backdrop for the precious metals complex has remained mixed so far this month, with the dollar now up (negative for gold) and US real rates now down (positive for gold). This kind of environment is not conducive to a strong gold pricing.
That said, I contend that the macro backdrop for gold could turn friendlier should the worst be not over. Indeed, a continuation of sell-off in equities and a further rise in the VIX could force the market to reprice the number of Fed rate hikes this year, notwithstanding the recent uptick in inflation.
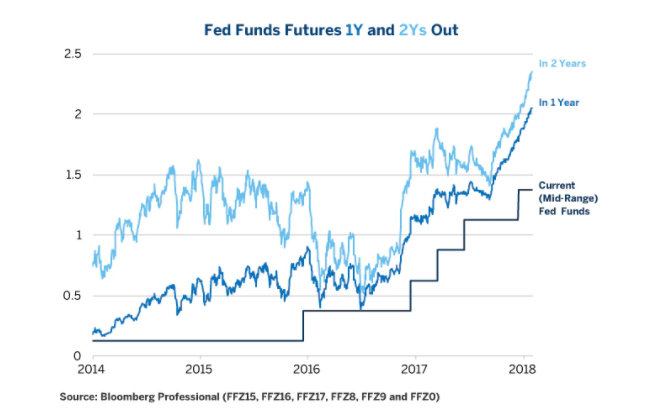
Source: Erik Norland, CME Group
As can be seen above, Fed tightening expectations have been soaring in recent weeks, precisely owing to growing signs of stronger inflation dynamics in the US. But the expected path of Fed funds rates could flatten meaningfully in case of a natural tightening in financial conditions caused a prolonged sell-off in equities. In this case, the dollar and US real rates could move lower, producing a supportive environment for gold.
Trading positioning
I have a positive long-term view (12m) on gold. As such, I think the best way to get exposure to gold is through the iShares Gold Trust ETF, thanks to its relatively low expense ratio of 0.25% (vs. 0.40% for GLD).
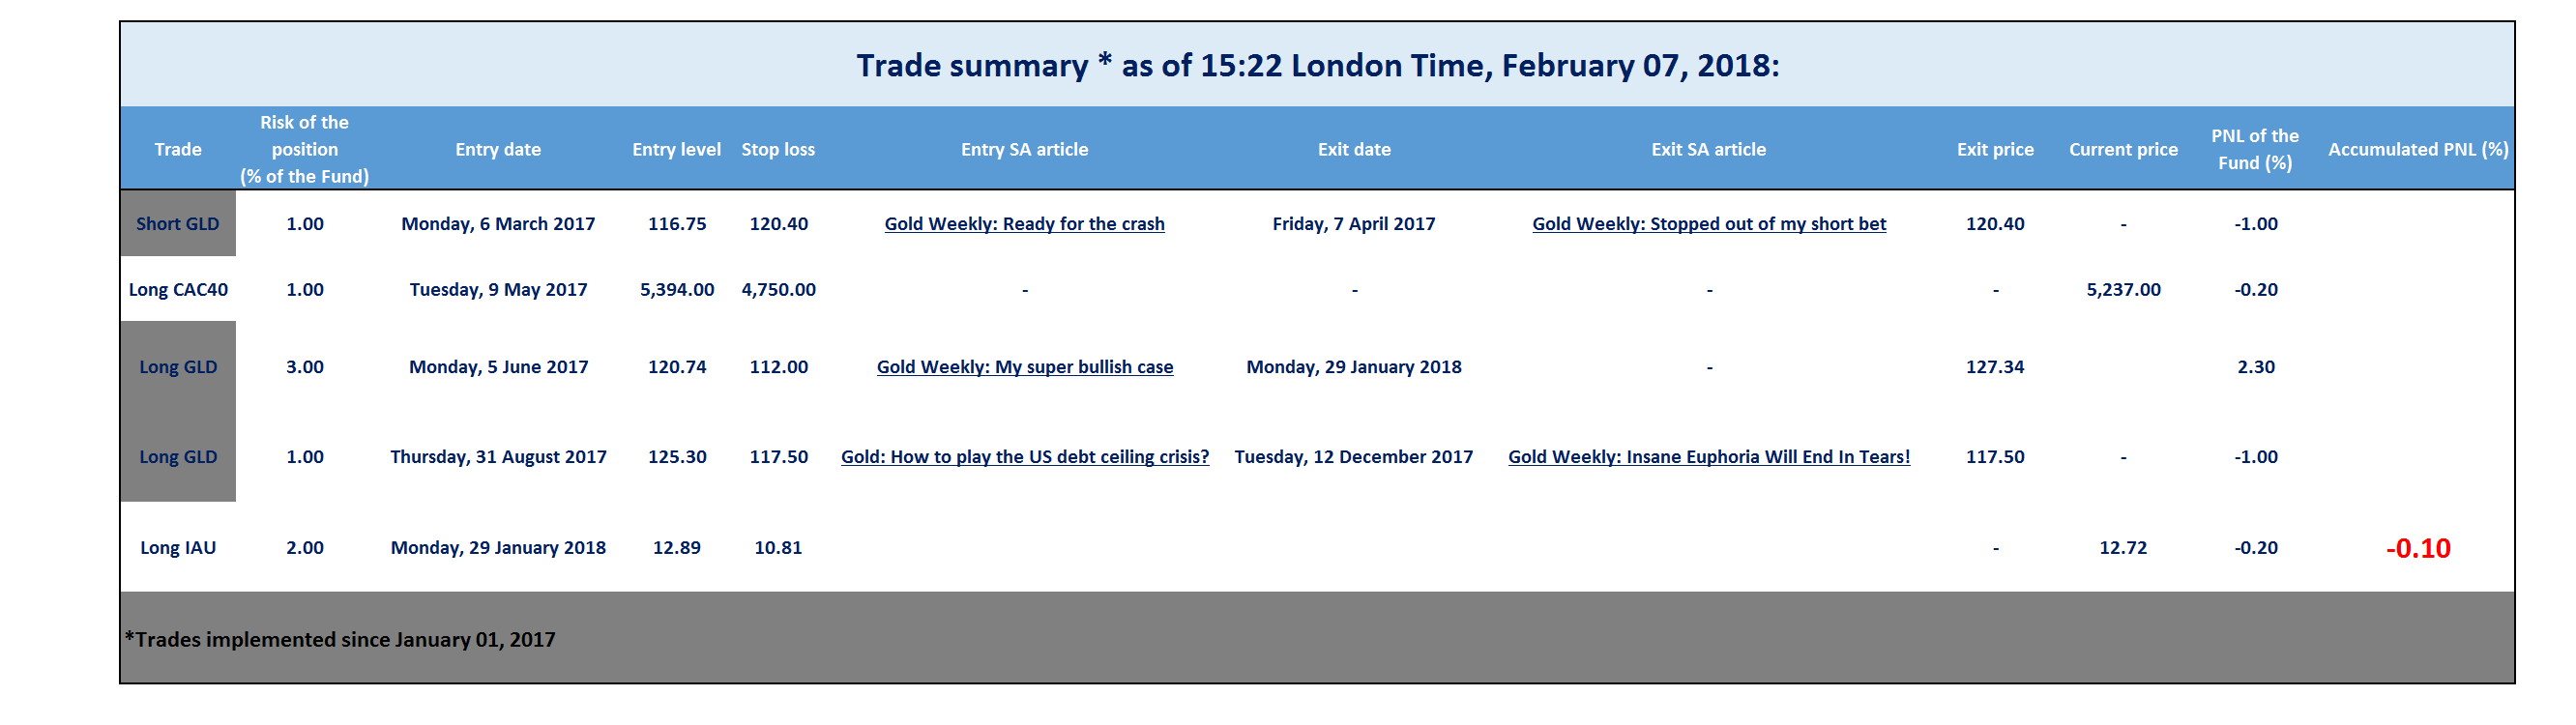
As a reminder, I took a long position in IAU on Monday, January 29, 2018, at $12.89. I set a stop-loss level at $10.81 (i.e., -16% from my entry point), which corresponds to the 2016 low. And I have a profit target at $19.00 (+48% from my entry point), which corresponds to the all-time high. This position has therefore a reward-to-risk ratio of 3, which is skewed in my favor.
Let's have a look at the technical picture of IAU.
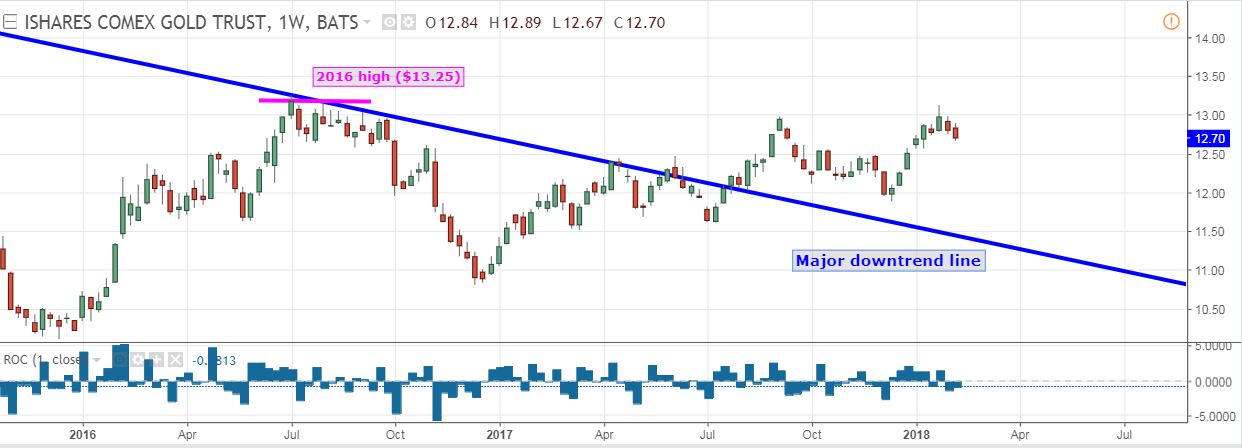
Source: Trading View
As can be seen in the weekly chart above, IAU has failed to firmly break above the $13 level, suggesting that the 2016 high remains a key resistance for now.
But I am not worried because the technical picture remains extremely bullish - the break above the downtrend line (on a daily, weekly, or monthly chart) in the summer of 2017 was a key bullish technical signal, portending a meaningfully positive change in trend, in my view.
In this context, I am inclined to treat any weakness as temporary, holding the view that the bull market in IAU has just begun. But don't get me wrong. Could we see further weakness from current levels? Yes. That's why I decided to set a relatively wide stop-loss level (at $10.81) to avoid getting caught by the noise of the market.
On the upside, I see the next major resistance at the 2016 high of $13.25. A firm break above this level would boost even further my bullish conviction.
For the sake of transparency, I will update my trading activity on my Twitter account and post my trade summary at the end of each report.
My dear friends, thanks so much for showing your support by pressing the "Follow" button and sharing this article. I look forward to reading your comments below.
Disclosure: I am/we are long GLD.
I wrote this article myself, and it expresses my own opinions. I am not receiving compensation for it (other than from Seeking Alpha). I have no business relationship with any company whose stock is mentioned in this article.