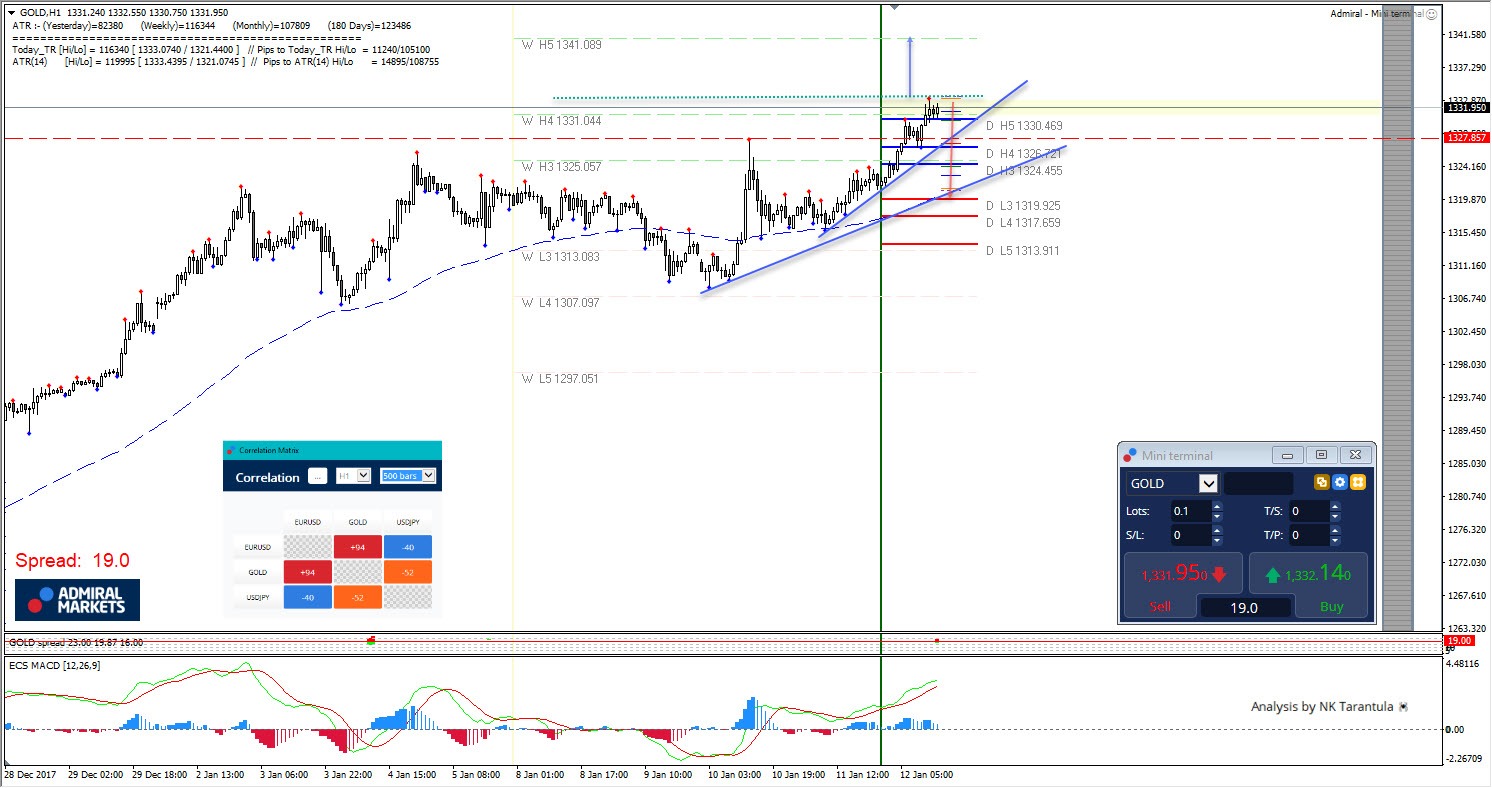
Gold Reached the Full ATR Projection
Gold has reached the full ATR projection boosted by the positive EUR flow and weaker USD. According to Admiral Correlation Matrix, we see a very positive correlation between EUR/USD and Gold on last 500 H1 bars. At this point we could see a retracement from the top 1333.40 and if the price breaks 1326.70 to the downside, next target might be 1320 zone. However, if the price breaks above 1334 then we could see 1341 before next retracement happens. Today is Friday so watch out for profit taking.
W L3 - Weekly Camarilla Pivot (Weekly Interim Support)
W H3 - Weekly Camarilla Pivot (Weekly Interim Resistance)
W H4 - Weekly Camarilla Pivot (Strong Weekly Resistance)
D H4 - Daily Camarilla Pivot (Very Strong Daily Resistance)
D L3 – Daily Camarilla Pivot (Daily Support)
D L4 – Daily H4 Camarilla (Very Strong Daily Support)
POC - Point Of Confluence (The zone where we expect price to react aka entry zone)
Interested in Gold technicals? Check out the key levels
R3 1334.72 R2 1329.33 R1 1325.87 PP 1320.48 S1 1317.02 S2 1311.63 S3 1308.17