Is Now The Right Time To Buy Gold?
Since gold has no intrinsic value and limited industrial applications, a position in gold is all about watching demand trends in the precious metal.
Introducing a quantitative system for gold investing based on trend following and relative strength.
Looking at the economic landscape, accelerating inflation could be a strong tailwind for gold.
Gold as an investment is a very particular asset class. The precious metal has some industrial uses, but its value is more related to its historic function as a store of value than functional applications. Unlike stocks or bonds, gold does not generate any cash flows, so it's practically impossible to tell if the metal is undervalued or overvalued in terms of intrinsic value through discounted cash flows.
The supply of gold is relatively fixed, or at least very stable, and the commodity doesn't generate any cash flows, so price fluctuations depend considerably on investor sentiment and demand levels.
When investing in gold, you want to make sure to be positioned on the right side of the main price trends for the metal, because it's practically impossible to analyze a position in gold by looking at valuation levels or projecting industrial needs.
In that spirit, this article takes a look at gold investing through a quantitative approach, focusing on price trends and relative strength to time positions in SPDR Gold Trust ETF (GLD), the most popular ETF to invest in gold.
Trend Following In Gold Markets
Trend following is one of the most simple and effective strategies to make investing decisions based on demand levels and price action. In a nutshell, trend following means that you only invest in a particular asset when the trend in prices for such asset is considered up over a particular period.
In order to evaluate if the trend is up or down, we can compare the current market price versus a moving average of past prices. The 10 month moving average is a widely used long term trend measure, and it works quite well at identifying major trends in gold prices over the years.
The chart below shows the evolution of SPDR Gold Trust ETF and its 10-month moving average since November of 2014. It's easy to see that the gold-tracking ETF was mostly above its 10 month moving average during the strong bull market from 2005 to 2012. The price of gold had a big drawdown in 2013, and it remained mostly sideways since then. This was clearly signaled by the fact that the ETF price moved substantially below the moving average in 2013, and then it crossed intermittently above and below the moving average during the sideways market in gold over the past several years.
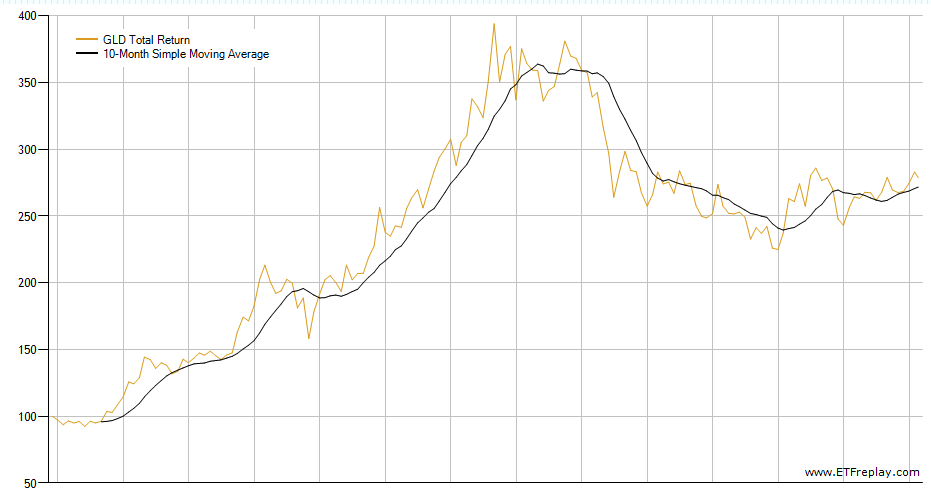
Source: ETFreplay.
Interestingly, the ETF is now above the 10 month moving average and gaining some distance from it. There is no way to know for certain if this will be a short-lived move or the beginning of another major uptrend in gold prices. However, since the indicator has done a sound job at identifying key trends in gold prices over the long term, this is an important fact to consider.
Relative Strength
Trend analysis is about comparing the current price versus past prices to evaluate if the trend is up or down. Relative strength, on the other hand, is about comparing different assets to evaluate which one is generating superior returns over a particular period. Even when both stocks and gold are in uptrends, you may want to buy stocks over gold when stocks are delivering superior relative performance.
The following system uses three ETFs to invest in different asset classes: SPDR Gold Trust to invest in gold, SPDR S&P 500 Trust ETF (SPY) to invest in stocks, and iShares 20+ Year Treasury Bond ETF (TLT) to invest long term government in bonds.
The system begins with a trend filter, an ETF can only be purchased when it's in an uptrend, meaning that the price is above the 10 month moving average. When gold, stocks, and bonds are all in a downtrend, then the system looks for cover in cash by buying iShares 1-3 Year Treasury Bond ETF (NYSEARCA:SHY).
Among the ETFs that are in an uptrend, the system buys the single one with the highest volatility-adjusted return over a combination of 3 months and 6 months periods.
The concept is quite simple and intuitive. We only want to invest in an asset class that is in an uptrend, and only if such asset class is outperforming the other alternatives over the middle term.
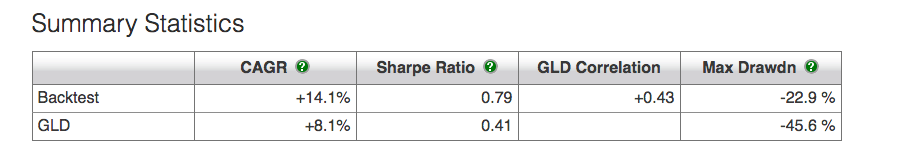
Backtesting numbers are quite attractive, since November of 2014 the system gained a cumulative 468.8%, far surpassing the 179.8% cumulative return produced by a buy and hold strategy in gold in the same period. This means an annual return of 14.1% for the system versus an 8.1% annual return for a buy and hold position in SPDR Gold Trust ETF.
Downside risk was also much smaller for the system, the maximum drawdown stands at 22.9% versus a maximum drawdown of 45.6% for the SPDR Gold Trust ETF.
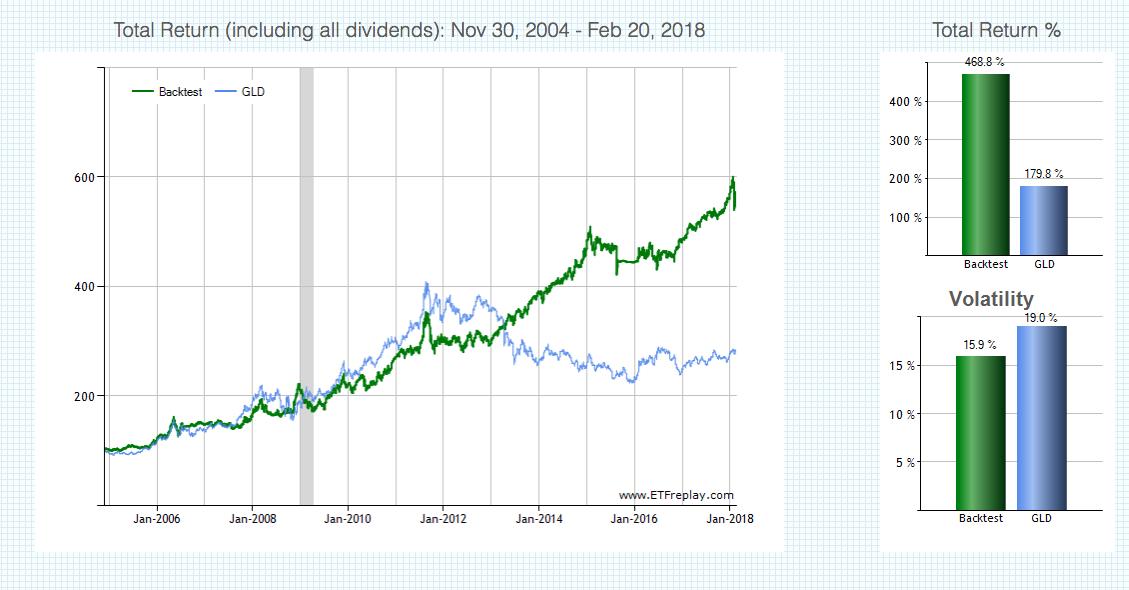 Backtesting data and chart source: ETFreplay.
 The system is quite effective at rotating between stocks, bonds, and gold to optimize returns and risk through a combination of trend-following and relative strength.
As of of the time of this writing, this system is betting on stocks above gold, which is due to the fact that SPDR S&P 500 ETF is delivering superior relative strength in comparison to SPDR Gold Trust. In a nutshell, gold looks better than in recent months, but still not as good as stocks.
Moving Forward
A position in gold is all about watching demand for the precious metal, and price trend looks encouraging. As long as the SPDR Gold Trust ETF remains above the 10 month moving average, currently around $122.5 per share, the risk and reward equation looks favourable to the bulls. On a relative strength basis, however, stocks look even stronger than gold.
In terms of the economic environment, gold could be a smart bet for investors who believe that inflation is going to rise more than expected in the middle term. The following chart from the New York Times shows that the labour market is in tight supply lately, and this has positive implications for wages.
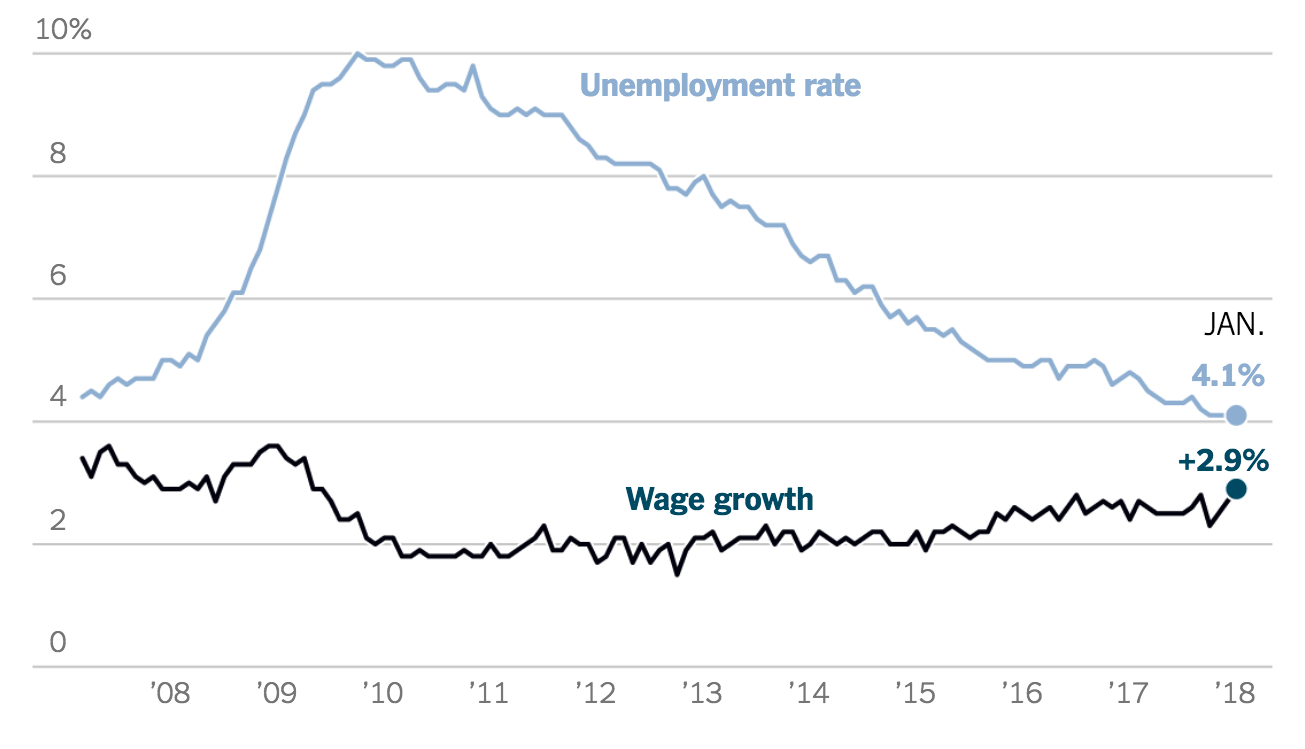 Source: New York Times
Offering a similar perspective, the chart from Bloomberg shows how inflation is gaining steam and coming in ahead of expectations lately. Since gold prices tend to increase in a scenario of rising inflation, the economic landscape could be providing a tailwind for the precious metal.
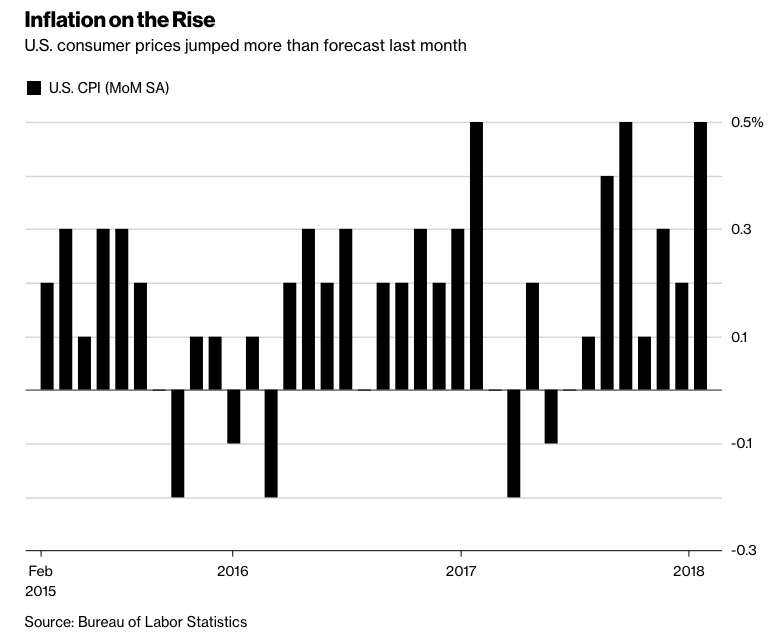 Source: Bloomberg
An investment idea should not be analyzed in an isolation, but in the context of a whole portfolio and considering the particular circumstances at the time. Gold looks better than it did several months ago, but not as strong as stocks.
However, adding some gold to a portfolio could be a smart move for investors who believe that inflation is about to rise more than expected in the coming months. In such scenario, gold could not only provide solid returns, but also diversification benefits to positions in stocks and bonds.
Members in The Data Driven Investor have access to quantitative systems to pick stocks and ETFs with the potential to outperform the market in the long term. In addition, the service offers multiple strategies to protect your portfolio in bear markets, and members know in real time when I make a buy or sell decision for my personal portfolio. Free trial available now in this link.
Disclosure: I/we have no positions in any stocks mentioned, and no plans to initiate any positions within the next 72 hours.
I wrote this article myself, and it expresses my own opinions. I am not receiving compensation for it (other than from Seeking Alpha). I have no business relationship with any company whose stock is mentioned in this article.