Junior Gold Miners Primed For A Big Move
From the technical point of view, the VanEck Vectors Junior Gold Miners ETF (GDXJ) is primed for a big move.
The share price of GDXJ is strongly correlated with the gold price.
If the support at $30 is broken, things may get ugly.
If the $30 support level holds and the broader stock market stabilizes, the triangle trading pattern may be broken to the upside.
The VanEck Vectors Junior Gold Miners ETF (GDXJ) is one of the best diversified ways of getting an exposure to the junior mining sector. Although its portfolio includes shares of 72 companies, including some mid-tier miners such as Yamana Gold (AUY), Kirkland Lake Gold (KL), New Gold (NGD) or IAMGOLD (IAG), some beginning miners such as Asanko Gold (AKG) or Pretium Resources (PVG) and explorers with projects of different sizes and in different stages of development, e.g. NovaGold Resources (NG), Seabridge Gold (SA), Continental Gold (OTCQX:CGOOF) or Gold Standard Ventures (GSV), GDXJ's share price was hit really hard by the 5-year-long commodity bear market.
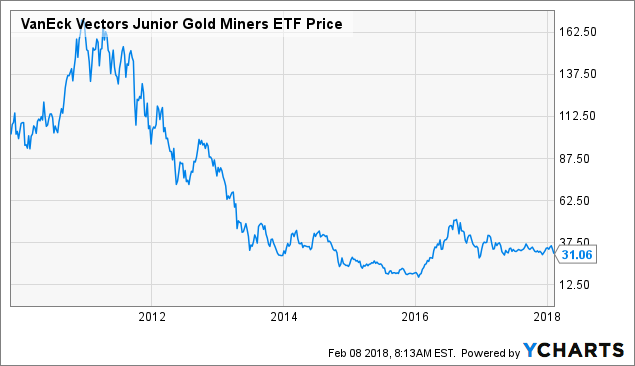
From the early 2011 highs above $160, the share price collapsed to the low of $16.87, reached in January 2016. The high-risk high-reward nature of this stock market segment was well demonstrated by the subsequent bull run, that brought GDXJ to the peak at $52.5, in early August 2016. It represented a 211% gain in slightly less than 7 months. The share price later retraced to the $30 area and traded in the $30-40 range for the better part of 2017. Right now, GDXJ seems to be at the crossroads once again.
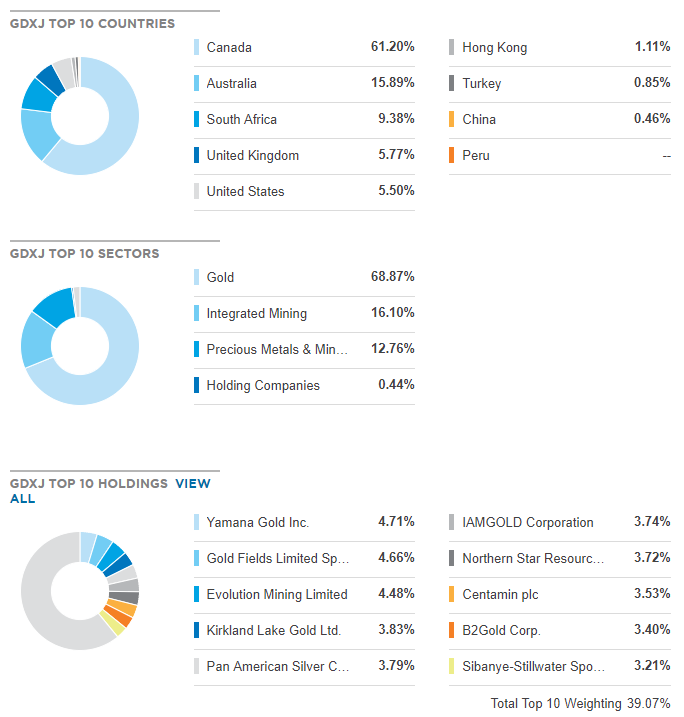
As shown in the charts below, the vast majority of GDXJ's assets (61.2%), the value of which is approximately $2 billion right now, is allocated in Canadian companies. It may indicate that the political risk is very low, however, some of the Canadian companies have operations located in risky countries, such as Philippines (Oceanagold (OTCPK:OCANF)), Greece (Eldorado Gold (EGO)), Burkina Faso or Cote d'Ivoire (SEMAFO (OTCPK:SEMFF)).
The top 10 GDXJ holdings include only shares of established gold miners, such as Yamana Gold, Gold Fields (GFI) (OTCPK:GFIOF), or B2Gold (BTG). These investments represent almost 40% of the portfolio and they should provide some stability, as share prices of these companies are usually much less volatile compared to the smaller explorers and developers. On the other hand, it is also hard to expect some tremendous triple-digit returns from them.
 Source: ETF.com
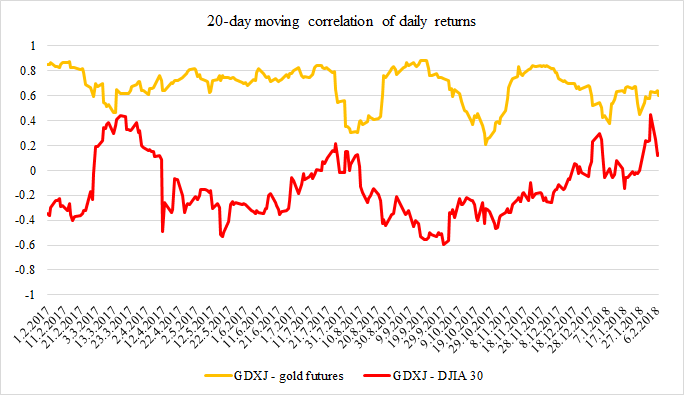
As GDXJ is focused on the mid-tier and junior gold miners, developers and explorers, it is natural to expect that its share price is significantly impacted by the gold prices. On the other hand, shares of the companies are a part of the broader share market, which means that it is reasonable to expect also some influence from the overall share market development. The chart below captures the values of 20-day moving correlations between GDXJ and gold and GDXJ and the Dow Jones Industrial Average daily returns, since January 2017.
 Source: Own processing
As can be seen, although there is some correlation between the GDXJ and DJIA 30 returns, there is a much stronger and more stable positive correlation between the GDXJ and gold returns. For the better part of 2017, the 20-day moving correlation between GDXJ and gold returns moved above the 0.6 level, which indicates a strong positive correlation. On the other hand, the correlation between GDXJ and the stock market moved in a wide range from -0.6 to 0.4.
During the investigated time period, there was not a single point when the 20-day moving correlation between GDXJ and DJIA 30 daily returns was higher than the 20-day moving correlation between GDXJ and gold's daily returns. Also the most recent values show that the correlation between GDXJ and gold stands at 0.6, while the correlation between GDXJ and DJIA 30 stands at 0.1.
It means that although the developments on the stock market surely have some impact on GDXJ's price performance, the gold price development is far more important. However, it is important to note that the relations are dynamic. If the current stock market weakness turns out to be more serious than a common correction, the subsequent panic may also pull GDXJ down, regardless of the gold price direction.
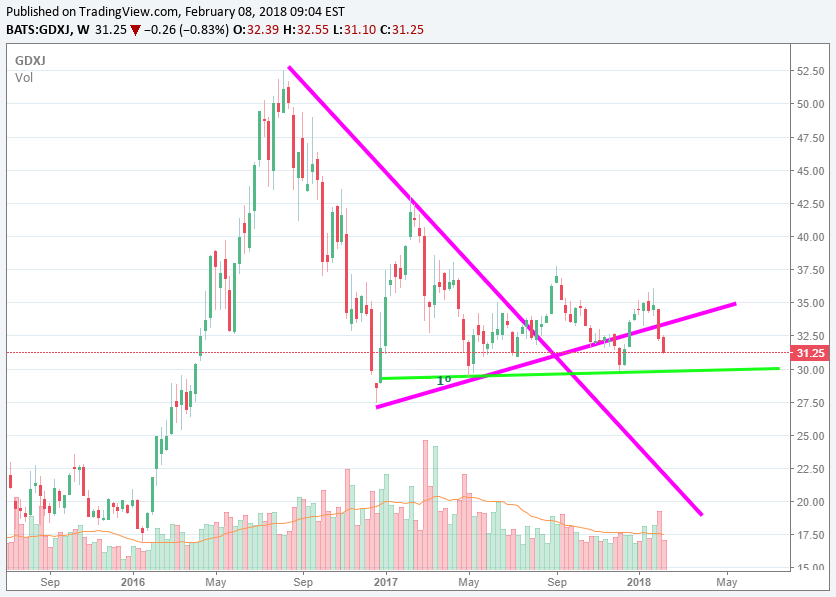 During the second half of 2016 and the first half of 2017, the share price created a triangle formation, by creating new lower highs and higher lows. In August 2017, it seemed like the formation is finally broken to the upside. However, after a short run, it started to decline again, only to create a new bottom in early December and a subsequent new high in late January 2018.
Over the last two weeks, GDXJ lost over 13% of its value and it is approaching the support in the $30 area. If the support is broken, another small support should be found around $27.5. After this, a free fall to the low 20s may become reality. On the other hand, if the $30 support level holds, it is possible to expect a bounce up to the $34-35 area. If the fundamentals are favorable, the stock market stabilizes itself and the gold prices remain strong, a breakout to the upside isn't out of question.
Given the length of the consolidation period, after the current trading pattern is broken, whether to the upside or to the downside, the following price movement should be pretty strong. This is why a long straddle (buying a call and a put option with the same strike price) or a long strangle (buying a call and a put option with different strike prices) options strategy may be an interesting option as well.
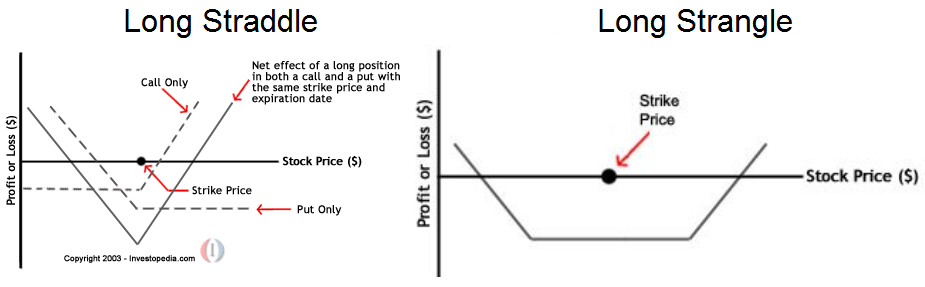 Source: Investopedia
Conclusion
The junior gold miners, represented by GDXJ, are at a crossroad once again. The GDXJ share price is moving in a sideways formation and it seems like a breakout is near. However, it is hard to say whether it will be to the upside or to the downside. If the current stock market weakness becomes more serious, it is reasonable to expect that the $30 support level will be broken. If even the next support in the $27.5 area doesn't hold, a serious bear move may follow.
On the other hand, if the stock market situation stabilizes and the gold price keeps growing, it is possible to expect an upward breakout of the triangle trading pattern. Given the length of the consolidation period, it is possible to expect that the upcoming price movement, whether positive or negative, will be strong. This is also why a long straddle or long strangle option strategy may deliver some nice gains over the coming months.
Disclosure: I am/we are long AKG, PVG.
I wrote this article myself, and it expresses my own opinions. I am not receiving compensation for it (other than from Seeking Alpha). I have no business relationship with any company whose stock is mentioned in this article.