Leveraged Gold Funds: 50 Years Of Horrific Performance
I simulate a 3x daily leveraged gold fund back for 50 years.
The fund performs horrifically: It is currently on a 38-year downturn and has lost as much as 99.8% of its value.
Despite that, I own shares of UGLD.
** This article deals with leveraged funds. Leveraged funds are not suitable for many investors. They are highly volatile, and can suffer enormous and long downswings. Please invest carefully.
Summary and Thesis
In this article, I simulate and backtest a 3x leveraged gold fund with fee characteristics based on VelocityShares 3x Long Gold ETN (UGLD). In my backtest, I find that the simulated 3x gold fund peaked in January 1980, and has been on a 38-year downturn since then. It has suffered as much as a 99.8% downturn.
Based on this test, I believe that UGLD may be suitable for traders, but UGLD is unsuitable for the vast majority of investors. Despite that, I am a shareholder of UGLD. The uncorrelated volatility provided by UGLD can be a valuable addition to a portfolio, as its returns may provide a valuable counterweight to the returns of stocks and bonds.
My Objective
I am considering constructing a leveraged portfolio, likely to include at least a leveraged bond fund and a leveraged equity fund. I expect to invest about 25% of my portfolio into the leveraged portfolio. This investment will be made in retirement accounts with a long timeline: I am 34 years old, and will not need this money for decades.
As part of this goal, I wish to backtest possible leveraged portfolios as far back as possible. Thus, I wish to simulate daily leveraged funds as far back as possible. In this article, I will simulate a leveraged 3x gold fund based on UGLD.
I have previously written about this portfolio several times. For those who missed my past articles:
Simulated leveraged equity fund performance to 1950 (Summary: +22.6% CAGR for 3x S&P 500 fund, but with 97% maximum drawdown.) Simulated leveraged bond fund performance to 1962 (Summary: +18% CAGR for 3x bond fund, but with 62% maximum drawdown.) Performance of Leveraged Portfolios Since 2006 (Summary: Better returns than the S&P 500, and lower drawdowns, too.) Examination of Beta Slippage in Leveraged Funds (Summary: Holding 3x daily leveraged funds is okay for stocks and bonds, but I wouldn't touch 3x VIX.)Currently Available Leveraged Funds
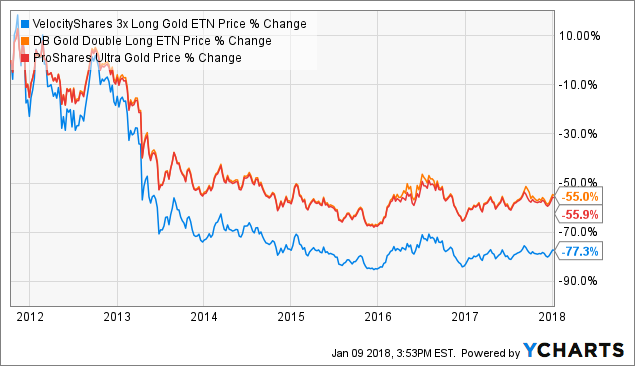
A wide variety of leveraged funds are available. In this article, I will focus on leveraged gold-based funds. Some of the currently available long gold leveraged ETFs include:
| Fund (Symbol) | Lev | Fees | AUM |
| VelocityShares 3x Long Gold ETN (UGLD) | 3x | 1.35% | $120 m |
| DB Gold Double Long ETN (DGP) | 2x | 0.75% | $120 m |
| ProShares Ultra Gold (UGL) | 2x | 0.95% | $100 m |
In my previous articles on equities and bonds, I recommended avoiding the 2x leveraged funds in favor of the 3x leveraged funds. My rationale was that the exposure/fees ratio was better for 3x leveraged funds. That rationale is not true for gold ETFs. DGP offers 2x exposure for only 0.75% fees, while UGLD's 3x exposure costs 1.35% in fees. DGP charges almost 20% less fees per point of exposure (0.375% versus 0.45%).
In equities and bonds, it is cheaper to blend unleveraged and 3x leveraged funds to achieve 2x leverage. This is not the case here, as 2x leveraged funds are less costly. Thus, depending on your desired leverage, using DGP over UGLD will often be correct. Personally, I prefer the higher leverage of a 3x fund. Its higher leverage still allows for higher returns for the same dollar investment, despite higher costs.
Data Set
To estimate the prices of a 3x daily leveraged gold fund, I need to find daily closing prices for gold. I have used the following data sources for this project:
1968 to 1975: London AM gold price from St Louis Fed. 1975 to present: COMEX gold futures prices from Quandl.Data from prior to 1971 should be taken somewhat lightly for this project. Until the Nixon shock, gold prices were tied to the US dollar. I considered excluding that data, but it would not alter results much.
For comparison, I have also compared returns with UGLD and with the price of gold itself.
Finding Daily Leveraged Returns
My primary comparison here is with UGLD, which is 3x leveraged daily and has annual fees of 1.35%. Therefore, returns will be based on those figures.
I will approximate UGLD as follows. First, I will make a first-pass approximation based on daily gold prices and the leverage and expense ratio of the fund. I will compare that data to the actual performance of UGLD. The primary goal is to ensure there is a high R2 between the values. I will then run a linear regression on my first-pass approximation, in order to improve the estimate.
To approximate UGLD, I first get the daily price change of gold, in percent. I multiply this change by the leverage of UGLD (3x), and subtract out the management fee of UGLD (about 5.3 x 10⁻⁵ or 0.0053%). This forms a first-pass at a simulated fund.
Initially, I tried to use this technique using the London morning gold price. The resulting data is a mess:
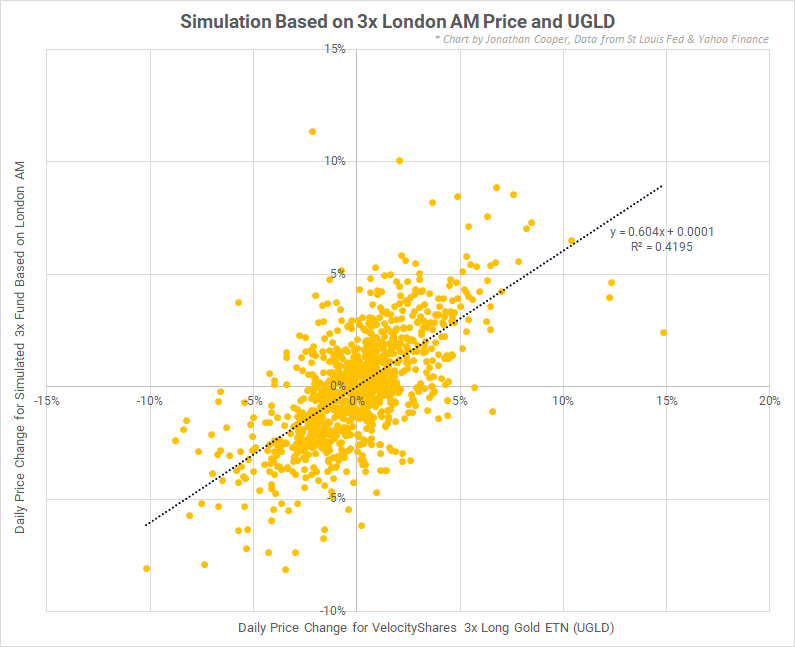
SOURCE: AUTHOR USING DATA FROM YAHOO FINANCE AND ST LOUIS FED
The scatter plot illustrates the most recent 1,000 days. The data is not useful, with an R2 of only 42%. This indicates that the London morning gold price can predict only 42% of the daily price changes in UGLD, which is not high enough for my purposes.
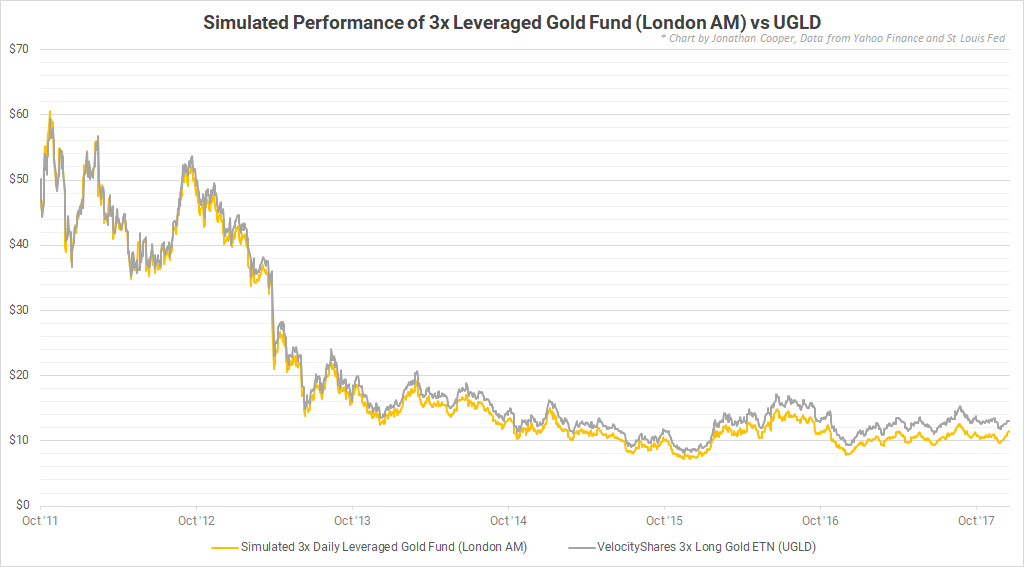
SOURCE: AUTHOR USING DATA FROM YAHOO FINANCE AND ST LOUIS FED
It should be noted, however, that while daily values diverge substantially, the overall simulation is still quite accurate. The reason for this divergence is likely due to the different market times between the London AM price (10:30 AM in London) and the close of trading for UGLD (4:00 PM in New York).
Therefore, for values after 1975, I am instead using COMEX gold futures prices. Creating the same two graphs using daily COMEX figures results in the following.
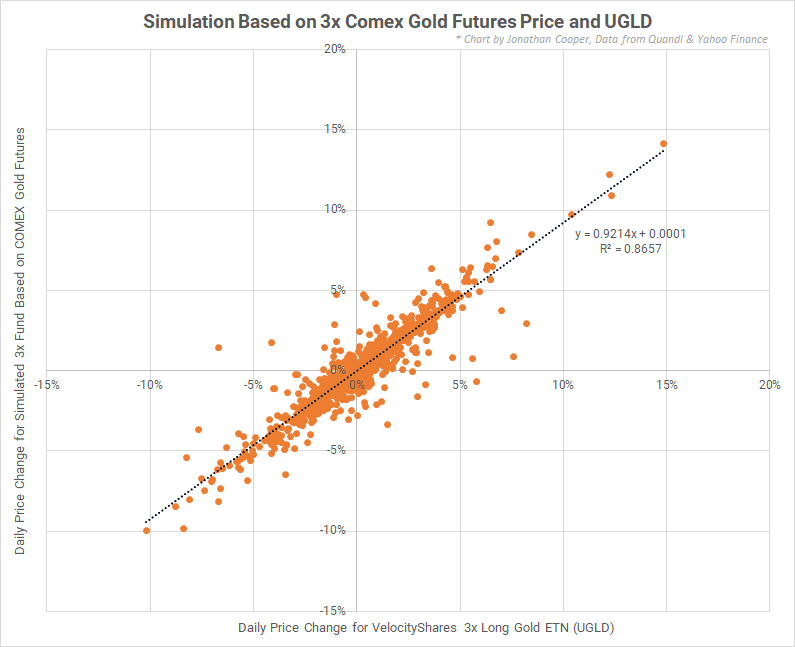
SOURCE: AUTHOR USING DATA FROM YAHOO FINANCE AND QUANDL
Results based on COMEX gold futures are a much better fit, with an R2 of 87% for the last 1,000 trading days. Over the last 300 trading days of UGLD, the R2 value is higher, at 92%. For this project, I used the last 300 trading days of UGLD, with a slope of 0.94 and an intercept of -1.7 x 10⁻⁴. This results in a better estimate of UGLD.
Comparing Simulated Returns With Actual Results
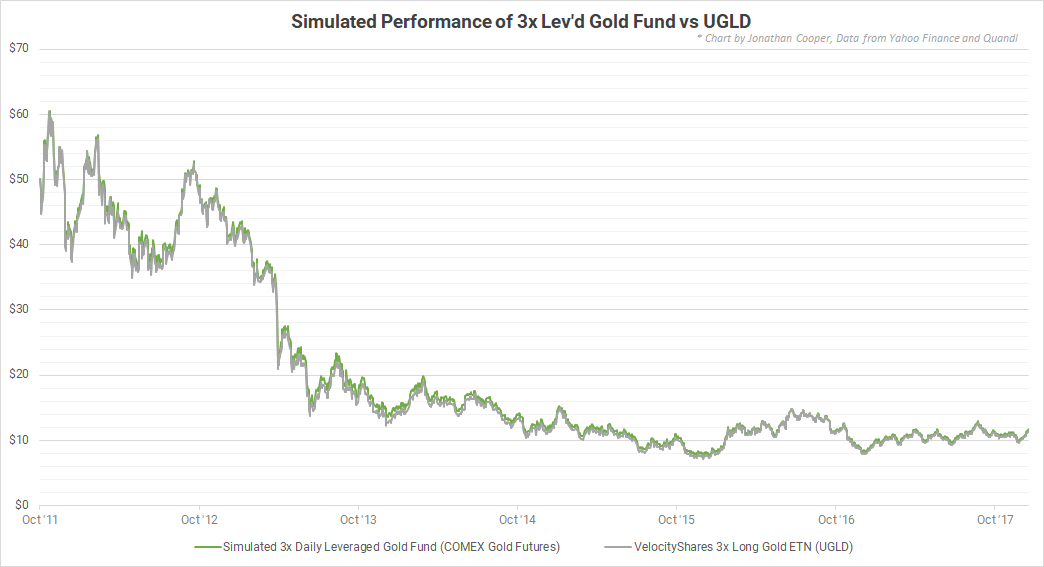
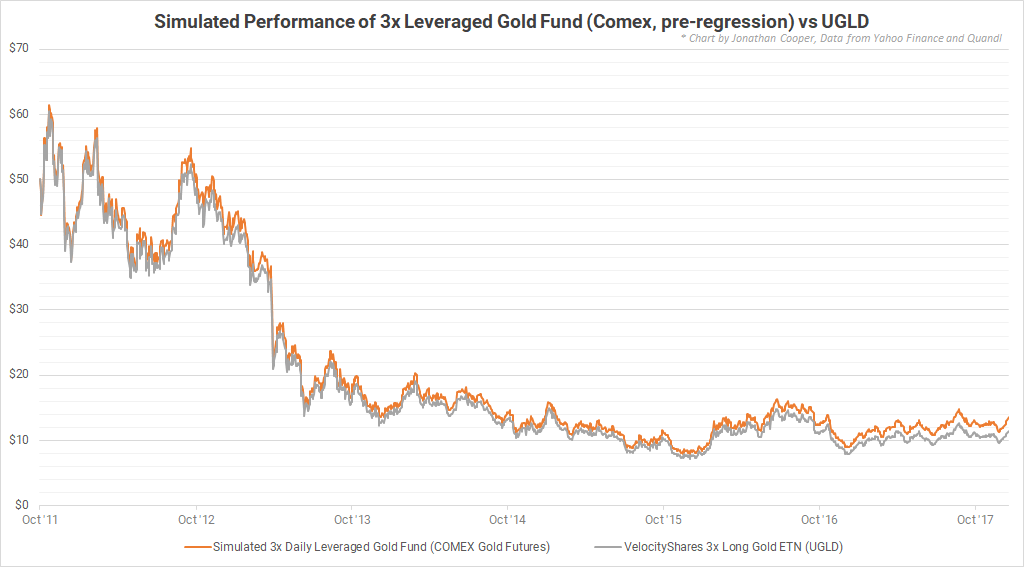
SOURCE: AUTHOR USING DATA FROM YAHOO FINANCE AND QUANDL
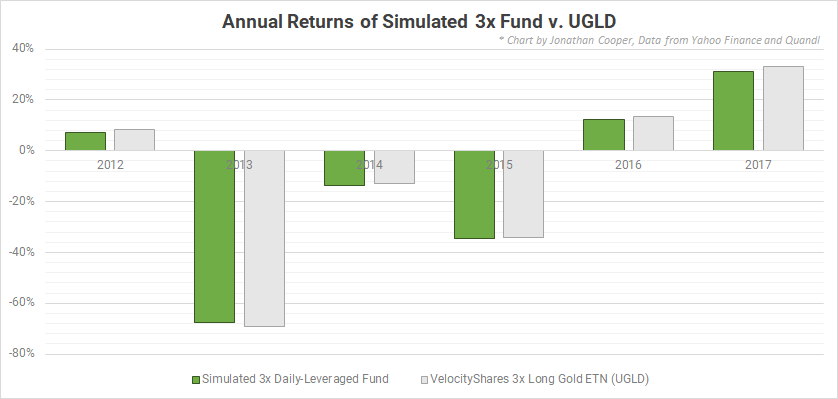
Returns from the simulated fund do not match UGLD 100%, but they are close to the returns of UGLD. Over the life of UGLD (since 2011-10-17), the simulated fund has outperformed UGLD by about 0.3% per year.
I would prefer an estimate that did not outperform UGLD at all, but this out-performance is minimal, at least. I would rather prefer a more conservative estimate though, in general, since I would prefer to underestimate the returns of backtested portfolios rather than overestimate those returns.
50 Years Of Simulated Returns
For these returns, I generally used the best data available. That is, I used simulated returns only when actual returns were not available. This is consistent with my overall goal of replicating actual achievable performance as closely as possible. Using simulated data when real data is available would be counterproductive.
I have also included the actual spot price of gold. The spot price of gold is just for comparison.
I used the following data for the leveraged fund:
2011 to present: Daily price movement of UGLD. 1975 to 2011: Simulated price data based on Comex gold futures. 1968 to 1975: Simulated price data based on London AM gold prices.| Since 1968-01-02 | Gold(Price/Ounce, no fees) | Simulated 3x Fund (3x Gold, 1.35% Fee) |
| Total Return | 36.5x | 2.7x |
| CAGR | 7.5% | 2.0% |
| Best Year | 136% (1980) | 749% (1980) |
| Worst Year | -33% (1982) | -72% (2014) |
| Max Drawdown | 70% (1999-08-25) | 99.8% (2001-02-15) |
| Longest Drawdown | 10,152 days (1980-01-21 to 2007-11-07) | 13,868 days (1980-01-21 to present) |
| Annual Excess Return | 2.7% | -2.7% |
| Annual Volatility | 20.4% | 61.4% |
| Sharpe Ratio | 0.13 | -0.04 |
Leveraged gold funds would have vastly underperformed actual gold.
An investment in gold would have shown a strong 7.5% CAGR since 1968, although most of these gains were made by 1980. Gold itself has not been a particularly strong investment (although I hesitate to refer to gold as an investment, due to its lack of cash flows). Gold has suffered through 70% downturns, and did not reach its 1980 peak again until 2007.
Despite that, gold has returned better than the risk-free rate since 1968. The risk-free rate used here is the 3-month treasury bill. Further, gold can be a valuable part of a diversified portfolio, due to its un-correlated and positive returns.
Meanwhile, leveraged gold funds would have fared terribly. These finds went on a monstrous run in the late 1970s and into 1980. A single share, set to a value of $35 in 1968 (the price of gold at the time) would be worth over $30,000 on January 21, 1980. That share price would then collapse over the coming days, weeks, months and years. Shares today would be worth only $95, far less than the same $35 investment into an ounce of gold in 1968.
The simulated 3x gold fund is on a 38-year long downturn, during which it has lost up to 99.8% of its value.
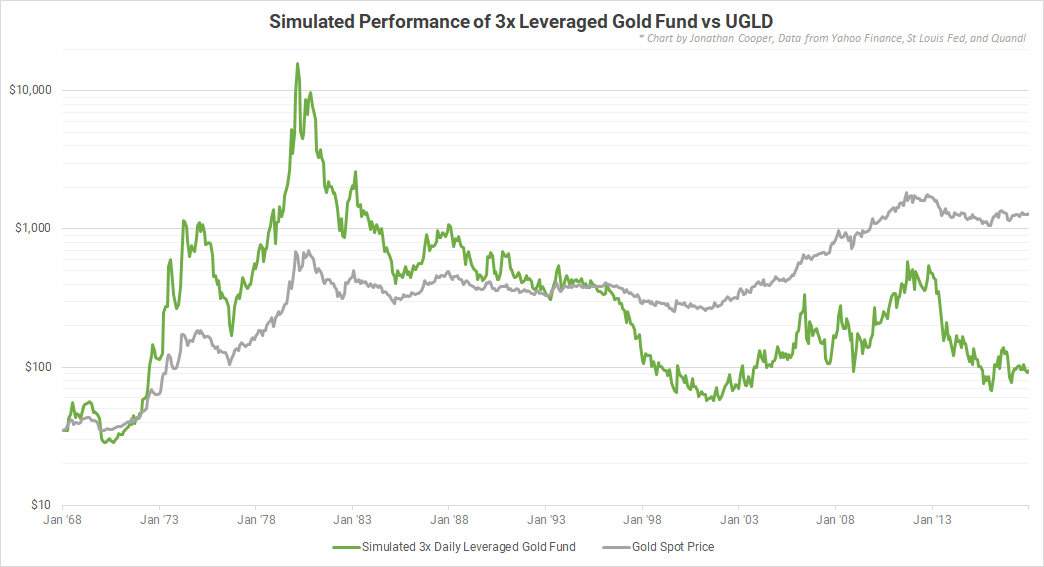
SOURCE: AUTHOR USING DATA FROM YAHOO FINANCE, ST. LOUIS FED, AND QUANDL
Conclusion And Further Work
Average investors should never invest in UGLD or other leveraged gold funds. These funds dramatically underperform gold over the long term. The fund suffers horrific downturns which may never end.
None of this is to indicate traders should not purchase UGLD, of course. UGLD is much more volatile than gold itself or gold-related ETFs. Thus, UGLD may often be an appropriate vehicle for short-term traders to bet on gold price movements. But average investors should steer clear, and never hold UGLD long-term without a plan.
I own shares of UGLD. I plan to hold these shares long term. Why?
Leveraged gold funds are very volatile, and can provide a valuable counterweight to the movement of other assets in a portfolio. Despite UGLD's overall negative performance, relative to the risk-free rate, it has shown strong performance during times in which the stock market and bonds have performed poorly.
In future articles, I will backtest portfolios including a simulated 3x gold fund and other leveraged funds. This will be chronicled in future articles, once I have completed additional simulations and backtests. I am invested in an approach that incorporates some degree of risk-weighting to balance leveraged equity funds, leverage bond funds, and UGLD. I will also look at adding other assets to the mix in the future, based on their performance in backtests and based on my own risk tolerance.
In the future, I will look at other leveraged asset classes, such as commodities and volatility indices, and also at "market-neutral" funds. I will also construct and backtest portfolios based on those simulated funds. I will test portfolios with leverage ratios ranging from 1x to 3x, and observe the changes in performance, including maximum draw-downs and Sharpe ratios.
* If you enjoyed this article, please hit "Follow" next to my name at the top of the page. This helps me build my readership and increases my visibility on Seeking Alpha. Please also leave questions, comments, feedback, and suggestions below. I am interested in building the best portfolio that I can, and would appreciate any input that you have on the subject. Thanks for reading!
Disclosure: I am/we are long UGLD.
I wrote this article myself, and it expresses my own opinions. I am not receiving compensation for it (other than from Seeking Alpha). I have no business relationship with any company whose stock is mentioned in this article.