Problems For Gold
Gold hit lows in mid-August, and the recovery seems to be failing.
The dollar is a bullish beast.
Interest rates are rising, and other commodities are falling.
Risk-off threatens the prices of all assets.
DUST can turn to gold if December 2018 turns out to be the fourth consecutive year of a low.
Gold was trading around its $1200 per ounce pivot point on the active month December futures contract on COMEX on Wednesday, November 13. Gold hit a low at $1161.40 in mid-August and recovered to a high at $1239.30 during the final month of October. The middle of the trading range for the yellow metal stands at $1200.35 per ounce. On Tuesday, November 13, the price of December futures traded from a low at $1196.60 to a high at $1205.50, with the midpoint of the range at just over the $1201 level. On Wednesday, the price was around the same level.
Gold is a metal where investment demand trumps all other factors as sentiment tends to establish the path of least resistance for the yellow metal. As we are now in the final six weeks of 2018, the gold market is facing a host of problems that could weigh on the price. Since November 1, the price has dropped by around $40 per ounce a. Now that the precious metal is back at its pivot point, gold is threatening to move towards the bottom end of its trading range and perhaps even lower if the past three years are a guide to gold market action in December.
Since gold mining stocks tend to move more than the price of the metal on the up and the downside, a move to the bottom end of the trading range over the coming days and weeks could turn dust into gold when it comes to the Direxion Daily Gold Miners Bear 3X ETF (DUST).
Gold hit lows in mid-August, and the recovery seems to be failing
The price of gold recovered significantly from the mid-August low, but now it is looking like a myriad of factors could threaten the bottom end of its trading range. 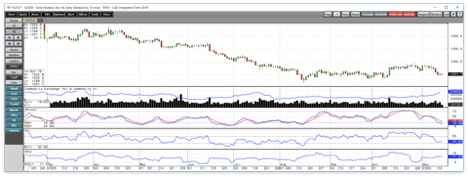
Source: CQG
As the daily chart of December gold futures highlights, the price of the nearby futures contract rose from $1167.10 on August 16 to a high at $1046 on October 26, a rebound of 10.4%. After trading in a range from $1213.40 to the high until November 9, gold broke down through the bottom end of its trading range reaching $1196.60 on November 13. Price momentum crossed to the downside on the daily chart along with relative strength which are both heading into oversold conditions. Daily historical volatility moved from 5.29% on October 29 to 11.32% on November 14 as the trajectory of the gold futures market has been increasing on the downside.
Meanwhile, open interest which is the measure of the total number of open long and short positions in the futures market increased from 474,941 contracts on October 30 to 539,520 contracts on November 13, a rise of 64,579 contracts or 13.6% as the price moved lower. Falling price alongside rising open interest is typically a bearish technical sign for a futures market. The current technical state of the gold market is bearish as the recovery has failed and taken the price back to the pivot point which could be the first stop before a test of the low for this year and perhaps even lower levels for the yellow metal.
The dollar is a bullish beast
The price of gold tends to move inversely to trends in the U.S. dollar. The mid-August low in the gold market came at a time when the dollar index rose to a new high for 2018 at 96.865 on the active month futures contract. 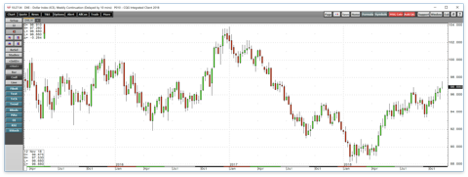
Source: CQG
As the weekly chart of the dollar index illustrates, the greenback corrected after the mid-August high reaching a low of 93.395 during the week of September 17 which sent gold back to the $1200 per ounce level. However, the dollar has come roaring back, and over recent weeks it made a higher and new peak for 2018 rising to 97.53 on November 12 which is weighing on the price of gold that is sitting at the $1200 per ounce level on the December futures contract as of November 13. While the higher level in the dollar did not push gold to the mid-August low, it has created an environment where that could occur sooner rather than later in the gold market.
The dollar index is trading at its highest level since June 2017, and the next technical resistance level for the index stands at the high from the week of May 29, 2017, at 97.70.
The dollar is rallying as the prospects for higher interest rates lit a bullish fuse in the U.S. currency.
Interest rates are rising, and other commodities are falling
With recent economic data pointing to 3.5% GDP growth in the U.S., unemployment at the lowest level since 1969, and inflationary pressures bubbling, the Fed has been raising interest rates. However, this tightening cycle stands out from others, as rates are moving higher in the short, medium, and long-ends of the yield curve.
As systems are go for a fourth interest rate hike of 25 basis points at the December FOMC meeting and two to three more hikes in the Fed Funds rate in 2019. At the same time, the legacy of quantitative easing continues to roll off the Fed's swollen balance sheet each month putting upward pressure on medium and long-term interest rates. The program of quantitative tightening in unprecedented, just as QE was a first for the Fed. Therefore, there is no history or yardstick for the impact that QT will have on the overall economy and markets across all asset classes.
Higher rates tend to weigh on the prices of commodities and stocks. Stocks fall as more attractive yields on fixed income securities draw capital from equities to bonds. Commodities decline in a rising interest rate environment because the cost of carrying inventories or long positions increases as financing rates move higher. Since early June, the price of COMEX copper has declined from $3.30 to $2.70 per pound. Since October 3, the price of NYMEX crude oil has dropped from $76.90 to under $56 per barrel. Lumber futures declined from an all-time peak at $659 per 1,000 board feet in May of this year to lows at just under the $300 level. There are many other examples of commodities that have moved appreciably lower over recent weeks and months. The price of silver has underperformed gold which could be the most significant signal for the yellow metal. While gold fell to its lowest price since early 2017 in mid-August, silver dropped to its lows since early 2016 in mid-September which was only 22.5 cents above the December 2015 bottom and level of critical technical support for gold's little brother. While gold was trading at $1202 on Wednesday, November 14, silver was back at the $14 per ounce level.
Meanwhile, gold has developed a habit of falling to the low for the year during the final month as the Fed prepared to hike interest rates in 2015, 2016, and 2017. While gold made a lower low in August, the historical pattern that has developed over the prior three years could mean that the yellow metal will challenge that bottom from a few months ago before the end of this year. The evidence all adds up to a gold market that is teetering on the brink of a selling frenzy.
Risk-off threatens the prices of all assets
The stock market has been rocky since the beginning of October as the impact of rising interest rates weighs on the equities asset class. 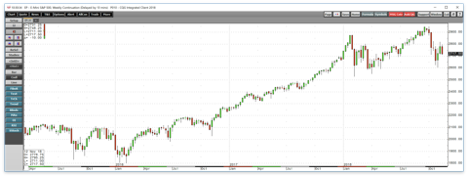
Source: CQG
As the chart of the E-Mini S&P 500 futures contract shows, the highs at 2,944.75 at the beginning of October led to a move to lows of 2,603 over recent weeks. The contract was trading closer to the low than the high on November 14 at the 2717.50 level.
Risk-off periods can impact the prices of all assets as investors and traders scramble to the sidelines and close all positions. In 2008, a severe case of risk-off hit markets, the price of most assets, including gold, fell sharply. The E-Mini S&P 500 contract fell from 1586.75 in October 2007 to lows of 665.75 in March 2009, a decline of 58%. During the heart of the selloff, gold fell from $1033.90 in March 2008 to lows of $681 in October 2008 a decline of over 34%. Therefore, risk-off in markets could cause selling in the gold market.
To complicate matters, the current trade dispute between the U.S. and China and economic lethargy in Europe are creating "dark clouds" that have gathered over the global economy according to the International Monetary Fund. Those dark clouds could give way to a risk-off period in markets across all asset classes. In the past, investors and traders ran to U.S. government bonds and other sovereign debt markets in Japan and Europe for safety, but the trend in U.S. interest could change that formula to a scenario where there is nowhere to hide if the bearish stars line up over the coming weeks and months.
At the same time, the recent midterm elections in the U.S. could sap optimism from the U.S. stock market at a time when bearish clouds are hovering over the asset class. The fiscal stimulus from tax and regulatory reforms during the first two years of the Trump Administration could come under scrutiny from the House of Representatives. The day after the election stocks rallied as the Republican Party held the Senate creating gridlock in government which has historically led to higher equity prices. However, the margin of victory in the Senate has slipped with the Democrats winning the race in Arizona, a recount in Florida, and another Senate election runoff in Mississippi later this month. Gridlock could mean an end to fiscal stimulus and further gains could threaten to reverse some of the initiatives that bolstered the stock market over the past two years.
DUST can turn to gold if December 2018 turns out to be the fourth consecutive year of a low
Some dark clouds are gathering over the gold market. A strong dollar, rising interest rates, the pattern of lows in December, falling commodities prices, and a volatile and shaky stock market all threaten to send the price of gold lower. While it is possible that gold would benefit from a flight to quality, the recent price action suggests that the market could be on the verge of a lower low in the coming weeks.
DUST is the Direxion Daily Gold Miners Bear 3X ETF product which is a short-term instrument that could explode to the upside if the price of gold and stocks drop over the coming weeks. The fund summary for DUST states:
The investment seeks daily investment results before fees and expenses of 300% of the inverse of the daily performance of the NYSE Arca Gold Miners Index. The fund invests in swap agreements, futures contracts, short positions or other financial instruments that, in combination, provide inverse or short leveraged exposure to the index equal to at least 80% of the fund's net assets. The index is a modified market capitalization weighted index comprised of publicly traded companies that operate globally in both developed and emerging markets, and are involved primarily in mining for gold and, to a lesser extent, in mining for silver. It is non-diversified.
DUST uses leveraged positions to achieve its triple bearish reflection in price action in gold mining stocks.
Over recent weeks, the price of gold dropped from $1239.30 on November 1 to a low of $1196.60 on November 13, or 3.5% lower. 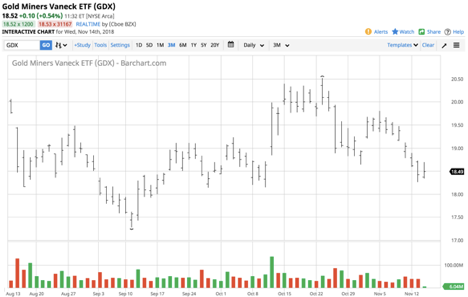
Source: Barchart
Over the same period, the GDX fell from $19.67 to $18.26 or 7.2%. 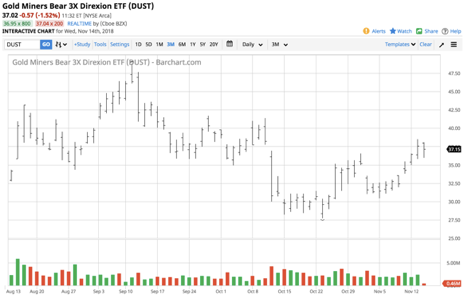
Source: Barchart
Meanwhile, DUST moved from $31 to $38.50 over the period, 24.2% higher. The ETF provided more than triple the move in the GDX which magnified the movement in the price of gold futures over the period.
DUST is only appropriate for short-term trades as its structure causes it to suffer from time decay. The high in DUST in 2013 was at $4,162.50 per share as it suffers from reverse splits.
Gold is facing lots of problems as it heads into the final weeks of 2018. While there are never guarantees in markets, the potential for a move to the downside has increased, and if gold hits a vacuum to a new low for 2018, DUST can be a golden instrument to profit from the woes of the gold market over the coming weeks.
The Hecht Commodity Report is one of the most comprehensive commodities reports available today from the #2 ranked author in both commodities and precious metals. My weekly report covers the market movements of 20 different commodities and provides bullish, bearish and neutral calls; directional trading recommendations, and actionable ideas for traders. More than 120 subscribers are deriving real value from the Hecht Commodity Report.
Disclosure: I/we have no positions in any stocks mentioned, and no plans to initiate any positions within the next 72 hours.
I wrote this article myself, and it expresses my own opinions. I am not receiving compensation for it (other than from Seeking Alpha). I have no business relationship with any company whose stock is mentioned in this article.
Additional disclosure: The author always has positions in commodities markets in futures, options, ETF/ETN products, and commodity equities. These long and short positions tend to change on an intraday basis.
Follow Andrew Hecht and get email alerts