Silver Could Get Messy
The $14-$15 trading range gives way to a lower low.
Silver never followed gold on the upside and did damage on the downside.
The dollar and interest rates could encourage trend-following shorts to push silver lower.
The line in the sand is not far from the current price.
DSLV could pay off if the bottom falls out in the silver market.
Silver has been a disappointment in the world of precious metals. While gold fell to a low in mid-August and recovered, silver waited until mid-September to hit a low. Gold has moved back to the midpoint of its trading range since the low at just over $1160 per ounce, but silver has moved to the bottom of its range and made a marginally new low on the December futures contract on November 13.
Silver is a volatile metal, so it tends to attract more speculative interest than gold or other precious metals. Since silver moves more on a percentage basis, trend-following longs and shorts often flock to the futures market when the price breaks above technical resistance or below technical support. At the bottom end of silver's trading range and not far off its lowest price since December 2015 which stands as critical technical support, the price action in the silver market is looking very dicey these days.
The Velocity Shares 3X Inverse Silver ETN product (DSLV) and its bullish counterpart (USLV) are useful tools for those who do not venture into the futures market on COMEX. If a big move in the silver market is on the horizon, one of these two products could produce significant returns on a short-term basis.
The $14-$15 trading range gives way to a lower low
As of last Friday, silver traded in a range from $13.86 to $15.07 since mid-August.
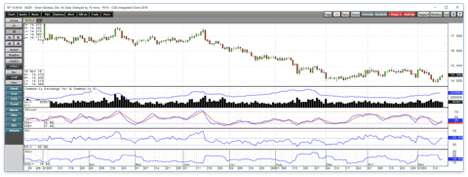
Source: CQG
As the daily chart highlights, the dollar's new high in mid-August sent the price of silver to a new low for 2018 at $14.405. Even though the dollar corrected from its new high at 96.865 on the dollar index following the mid-August peak, silver continued to fall reaching a low at $13.965 on the December futures contract on September 11 before it recovered to $14.95 on October 2. After another attempt to challenge technical resistance at the $15.07 per ounce level on November 2 that only made it up to $14.92, the price of silver turned south.
On November 12, the dollar index made a higher high at 97.53, and silver made a lower low at $13.86 on November 14. Since then, the dollar moved back below the 96.50 level, and silver recovered to a high of $14.40 last Friday.
The $14-$15 range gave way to a lower low on November 12-14. Both the price momentum and relative strength indices fell into oversold territory and turned higher as silver bounced from its new and lower low last week. Meanwhile, open interest has moved from 197,576 contracts on October 19 to 224,864 on November 15, an increase of 27,288 contracts or 13.8%. The price made a lower low over the period, and falling price alongside rising open interest is typically a bearish signal in a futures market. It is possible that trend-following speculative shorts are coming to the silver market preparing for a break to the downside.
Silver never followed gold on the upside and did damage on the downside
While gold fell to lows for 2018 in mid-August at just over $1160 when the dollar traded to a new high, the corrective move in the greenback that followed caused gold to move back to the $1200 level. However, silver kept on going on the downside falling below the $14 per ounce level in mid-September as silver did not follow the yellow metal to the upside following the dollar's correction from the highs in September.
When gold broke above the top end of its trading range at the $1220.70 level on the December futures contract in mid-October, silver did not move above its resistance level at $15 per ounce. Given the most recent price action in the gold and silver markets, silver had been sending the gold market a warning signal.
Silver broke to a new low for 2018 on November 12-14, but the price of gold remained almost $40 above its nadir on November 14. Silver continues to send gold a message as the price relationship between the two metals moved to a new and higher high. 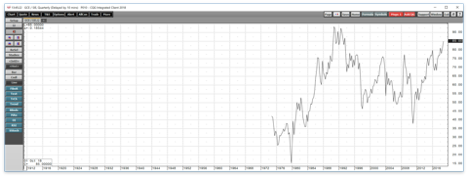
Source: CQG
As the quarterly chart of the price of gold divided by the price of silver shows, it currently takes 85 ounces of silver to purchase one ounce of gold which is the highest level since 1993, in a quarter of a century. The ratio between the two metals tends to move higher during bear markets and lower during bullish periods.
The dollar and interest rates could encourage trend-following shorts to push silver lower
The price action in the dollar and the path of short, medium, and long-term interest rates are also sending gold a signal as it heads into the dangerous month of December where the yellow metal has declined to lows over the past three consecutive years. 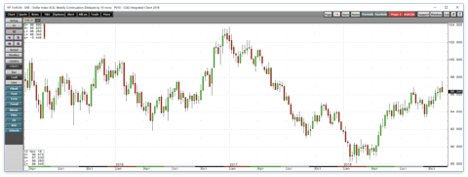
Source: CQG
The chart of the dollar index shows that the greenback rose to a new and higher high this week at 97.53, the highest level since June 2017. A strong dollar tends to weigh on the prices of gold and silver. By the end of last week, the dollar had moved back to below the 96.50 level and gold and silver prices recovered.
The Fed will almost certainly hike rates at their December meeting which increases the cost of carrying long positions and commodities inventories. Higher real rates tend to weigh on raw material prices. At the same time, the Fed only controls the short-end of the yield curve via the Fed Funds rate. However, these days, the program that has caused the legacy of QE to roll off the Fed's balance sheet has caused rates to rise on the medium and long-end of the yield curve. The QT program, just like QE, is an unprecedented event in history, so its impact on markets remains conjecture. 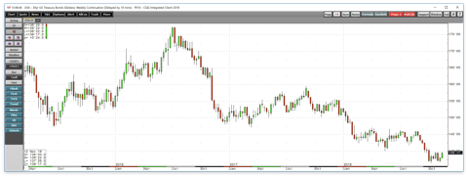
Source: CQG
Meanwhile, the chart of the 30-year Treasury bond leaves little room for doubt that the trend in rates is higher. The long-bond dropped from 177-11 in July 2016 to its most recent low at 136-11 in early October. At 139-17 on November 16, the long-term interest rate instrument remains not far off its recent low. A factor that is bolstering the prices of bonds these days is the flight to quality attraction as the stock market has experienced increased volatility throughout October and into November.
The short-side of the silver market is starting to look like a juicy trade for market speculators. The growing open interest metric in the futures market could be a sign that short positions are building, and trend-following traders are preparing to push the price of the volatile precious metal to a level that could turn out to be the most significant test in years.
The line in the sand is not far from the current price
Critical technical support for the silver market stands at the December 2015 low at $13.635 per ounce. On November 14, the most recent low at $13.86 put the price only 22.5 cents or 1.6% above the price that is a bottom that has stood for three years. The 2015 bottom was the lowest price for silver since August 2009, when the metal was on its way to a high at $49.82 on April 2011. 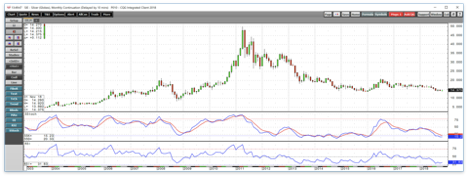
Source: CQG
As the monthly chart shows, silver is trading close to its critical technical support area on the long-term chart. A move below the $13.635 level could trigger a tsunami of selling in the silver market. The break above or below a price that has stood as support or resistance for a long period tends to attract lots of speculative interest to a futures market. Those speculators love to go after silver which is now on the brink of trading to the lowest price in almost a decade. Silver has been in a downtrend since 2016 when the price turned lower from the post-Brexit high at $21.09. While momentum and relative strength indicators are in oversold territory on the long-term chart, the trend remains bearish. Meanwhile, if shorts are increasing their positions, we could experience another recovery which is telling us that tension in building in the silver futures market and a significant move could be on the horizon.
DSLV could pay off if the bottom falls out in the silver market
Trend-following speculators love the silver market because every once and a while it offers them the opportunity to hop on a trend that results in a considerable price move on a percentage basis. Silver settled at $14.382 on the December futures contract last Friday. With silver sitting at 74.7 cents above its three-year low, and currencies, bonds, and other commodities sending bearish signals for the precious metal, the odds of a test of the lows or a vacuum to the downside are increasing. The Velocity Shares 3X Inverse Silver ETN product (DSLV) is a turbocharged bearish silver instrument that is only appropriate for short-term forays into the silver market, but this could be the be the perfect time for DSLC from a risk-reward perspective. The fund summary states:
The investment seeks to replicate, net of expenses, three times the opposite (inverse) of the S&P GSCI Silver index ER. The index comprises futures contracts on a single commodity. The fluctuations in the values of it are intended generally to correlate with changes in the price of silver in global markets.
DSLV and its bullish counterpart, USLV, use a leveraged futures positions to create a triple magnified result in the silver market on the downside in the case of DSLV, and the upside when it comes to USLV. The leverage comes at a price, so both instruments suffer from time decay making them only appropriate for short-term trading and investing purposes. I typically do not hold either DSLV or USLV for longer than two weeks, and most of my trades are of shorter duration. Both products are susceptible to reverse splits. USLV recently underwent a 1-10 reverse split which is the price for leverage.
The price of silver dropped from $14.92 on November 2 to $13.84 on November 14. The loss of $1.06 per ounce or 7.1% is a continuation of lower lows that could trigger stop-loss and speculative selling. 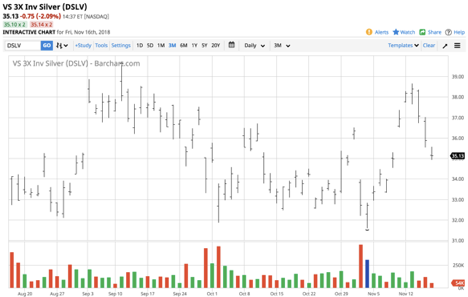
Source: Barchart
DSLV rose from $31.59 to $38.65 over the same period, a rise of 22.3% which is slightly more than triple the percentage move in the price of silver from November 2 through November 14.
There are lots of signs in markets that the silver market could get messy on the downside as it approaches its critical technical support level. While timing is everything in markets, December could be a significant month for both gold and silver as they have been weak during the final month of the year in 2015, 2016, and 2017. If silver is preparing for a break to the downside, DSLV could be the perfect tool to hop on a bearish trend. Meanwhile, if the silver market holds the critical technical level, USLV is a tool that will move higher in turbocharged fashion as shorts scramble for the exits. We could be in for a volatile period in the silver market over the coming weeks as the end of the year approaches.
The Hecht Commodity Report is one of the most comprehensive commodities reports available today from the #2 ranked author in both commodities and precious metals. My weekly report covers the market movements of 20 different commodities and provides bullish, bearish and neutral calls; directional trading recommendations, and actionable ideas for traders. More than 120 subscribers are deriving real value from the Hecht Commodity Report.
Disclosure: I/we have no positions in any stocks mentioned, and no plans to initiate any positions within the next 72 hours.
I wrote this article myself, and it expresses my own opinions. I am not receiving compensation for it (other than from Seeking Alpha). I have no business relationship with any company whose stock is mentioned in this article.
Additional disclosure: The author always has positions in commodities markets in futures, options, ETF/ETN products, and commodity equities. These long and short positions tend to change on an intraday basis.
Follow Andrew Hecht and get email alerts