Silver Has Not Responded To Gold - Yet
Gold breaks higher.
Silver remains below resistance.
Silver tried to encourage gold lower in September but failed.
Silver could attract a speculative herd.
USLV could be a good short-term bet, but use a stop if it starts going south.
Gold and silver have long histories as a means of exchange or hard money. The precious metals have been around a lot longer than the fiat currencies we use each day to pay bills, purchase goods, and save for the future. The dollar, euro, yen, and all of the other currencies of the world have short histories compared to the precious metals. Foreign exchange instruments are fiat currencies and only have the backing of the full faith and credit of the government's that print the bank notes.
Central banks tend to be very quiet about gold and silver. However, most monetary authorities around the globe hold significant gold reserves that are classified in the IMF statistics as foreign exchange reserves. While they rarely speak about gold, central banks are the world's biggest holders of the metal. Additionally, governments continue to be net buyers of gold with China and Russia leading the way to catch up with the U.S., Europe, and other countries when it comes to the percentage of gold holdings in their total foreign exchange reserves.
Gold is a currency, and in many ways, the yellow metal is the equivalent of bank notes. Silver has a role as the change that jingles in our pockets. My grandfather who passed in the early 1980s never called the quarters, dimes, nickels, and pennies in his pocket change; he referred to it as silver. Silver tends to move more than gold on a percentage basis. Recently, gold broke to the upside as the stock market began to correct, but silver has yet to display the same bullish price action as the yellow metal.
Gold breaks higher
There was no guaranty that gold would move higher when stocks began to fall during the week of October 8. In fact, the price of gold often moves lower during periods where stocks hit the skids and markets go into a protective or risk-off mode. However, gold powered higher and through the top end of its trading range that had been in place since late August. 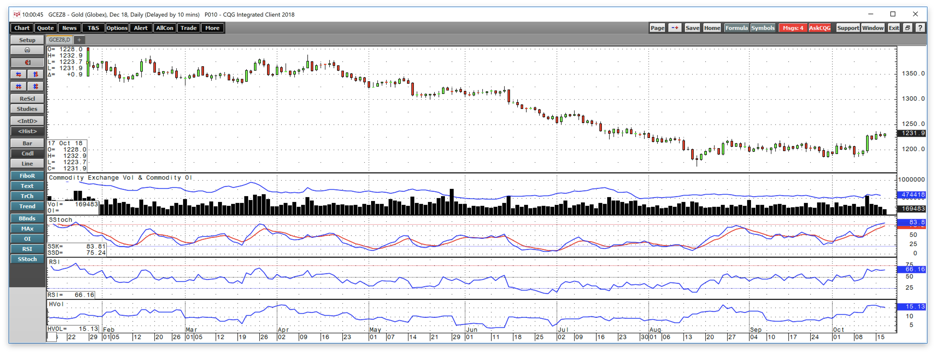
Source: CQG
The daily chart of December gold futures shows, that while the yellow metal did not explode to the upside, it did break above the first technical resistance level that stood at the August 28 high at $1220.70 per ounce on October 11 and traded to a high of $1236.90 on October 15. Gold was trading at the $1231 per ounce level on October 17 as the yellow metal remained above the technical breakout level which has become short-term support.
Silver remains below resistance
Gold moved above a technical level, and while the price of silver also moved to the upside, its performance was a lot less impressive than the yellow metal. 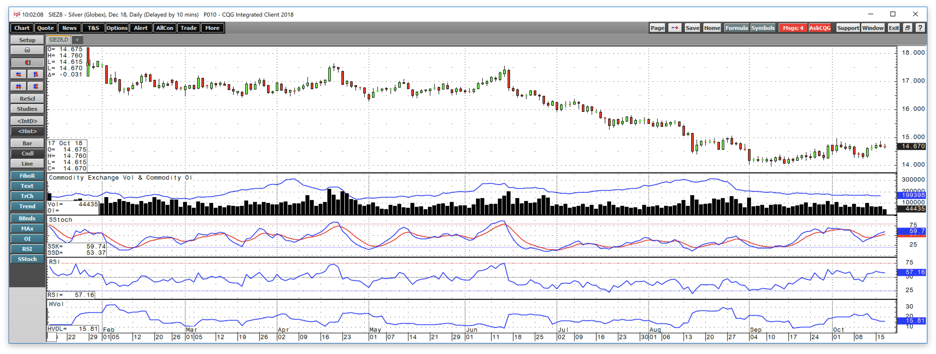
Source: CQG
Technical resistance in the COMEX silver futures market stands at $14.95 per ounce on the December contract which was the October 2 high and the peak price for the precious metal dating back to late August when silver traded to the $15.07 level. As stocks fell and gold rallied, silver has only made it up to a high of $14.88 on October 16, seven cents below its early October peak and 14 cents below the next level from late August. Price momentum on the daily gold chart crossed higher and continues to rise while it remains in neutral territory on the daily silver chart.
Silver tried to encourage gold lower in September but failed
Gold fell to its low in 2018 in mid-August when the price reached $1161.40, the lowest level since early 2017. From August until its most recent break to the upside, gold traded around the $1200 per ounce pivot point on the December futures contract even though silver continued to experience price pressure. 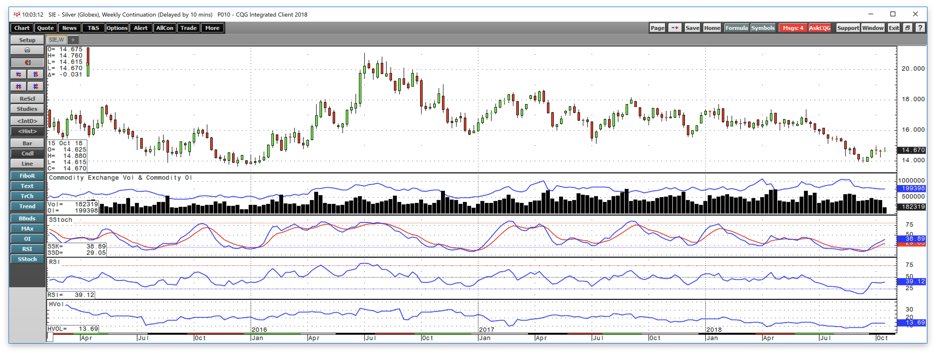
Source: CQG
As the weekly chart shows, silver waited until mid-September to find its bottom which was below $14. Nearby COMEX silver futures reached a low of $13.91 on September 11 which was the lowest price since early 2016 and only 27.5 cents above the critical level of support and long-term line in the sand for the precious metal at the December 2015 low of $13.635 per ounce.
Silver's decline below $14 was an attempt to beckon gold lower, but it failed, and lack of follow through on the downside led to a recovery to $14.95 in early October. Gold did not follow silver lower, and more recently, silver has yet to follow gold higher and above its technical resistance level. Neither of the metals has validated moves in the other since August. Meanwhile, price momentum on the weekly silver chart crossed higher and displays a bullish trend with the price of the metal sitting at under the $14.70 level on October 17.
Silver could attract a speculative herd
Gold had been under pressure since falling from the late April high at $1365.40. The first sign of a potential recovery came on October 11 when the yellow metal broke its pattern of lower highs and moved outside of the trading range that had been in place since late August.
Silver traded to a high of $17.35 per ounce on the continuous futures contract in mid-June which was just one cent below its resistance level at the mid-April high of $17.36. A move that takes out the $14.95 and $15.07 tops in the silver market could attract a herd of buyers looking for a challenge of the June and April highs at over $17 per ounce. Silver typically attracts more speculative interest than gold and other precious metals because it tends to move the most on both the up and downside on a percentage basis. Silver also has a mind of its own, and it moves when market participants are usually not watching. The break to the upside in the gold market provides a degree of bullish support for silver which could just be biding its time before it explodes above the $15 level and validates the move in gold. However, gold has not exactly set the world on fire, and it is possible that the recent rally will wind up with bulls crying the same golden tears they have shed since April.
USLV could be a good short-term bet, but use a stop if it starts going south
The Velocity Shares 3X Long Silver ETN product (USLV) and its bearish compliment (DSLV) turbo charge price action in the silver market. The fund summary for USLV states:
The investment seeks to replicate, net of expenses, three times the S&P GSCI Silver index ER. The index comprises futures contracts on a single commodity. The fluctuations in the values of it are intended generally to correlate with changes in the price of silver in global markets.
USLV and DSLV get their bullish or bearish leverage from leveraged futures and options positions which creates the ability for triple returns on the up and downside of the silver market. Both of these products suffer from significant price decay because of their structures. The USLV product just experienced a 1-10 reverse split. Therefore, they are only appropriate for very short-term positions on the long or short side of the silver market. 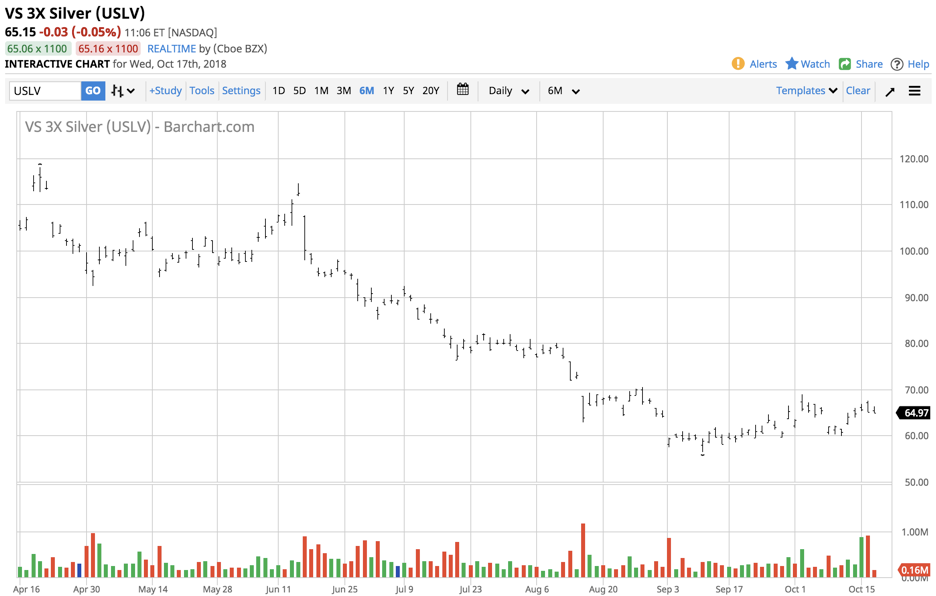
Source: CQG
As the chart shows, USLV moved from $59.85 on October 10 to a high at $67.50 on October 16, a rise of 12.8%. Over the same period, silver futures moved from lows of $14.255 on October 10 to a high of $14.88 on October 16, an increase of 4.4%. USLV does a reasonable job capturing short-term triple leverage in the silver market. However, the results can be ugly on a long-term basis. In February 2012, the split-adjusted price of USLV was above the $6500 per share level, so the tools of leverage eat away at the value of this product like cancer. I only use these products on the long and short side of the market for periods of two weeks or shorter.
If silver is going to follow the price action in gold, USLV could be a great tool for turbocharging gains over the coming sessions. Gold is waiting for silver to either validate its attempt to rally or negate the move. In the short term, I think silver could make a run above the $15.07 per ounce level which would put the bid back in the gold and silver markets. However, the longer gold and silver sit at their current price levels, the odds will rise that the prices have run out of steam and selling is likely to return to the markets. Right now, I am long USLV with a tight stop.
The Hecht Commodity Report is one of the most comprehensive commodities reports available today from the #2 ranked author in both commodities and precious metals. My weekly report covers the market movements of 20 different commodities and provides bullish, bearish and neutral calls; directional trading recommendations, and actionable ideas for traders. More than 120 subscribers are deriving real value from the Hecht Commodity Report.
Disclosure: I/we have no positions in any stocks mentioned, and no plans to initiate any positions within the next 72 hours.
I wrote this article myself, and it expresses my own opinions. I am not receiving compensation for it (other than from Seeking Alpha). I have no business relationship with any company whose stock is mentioned in this article.
Additional disclosure: The author always has positions in commodities markets in futures, options, ETF/ETN products, and commodity equities. These long and short positions tend to change on an intraday basis.
Follow Andrew Hecht and get email alerts