Silver attempting breakout at 20-year support
CLICK ON CHART TO ENLARGE
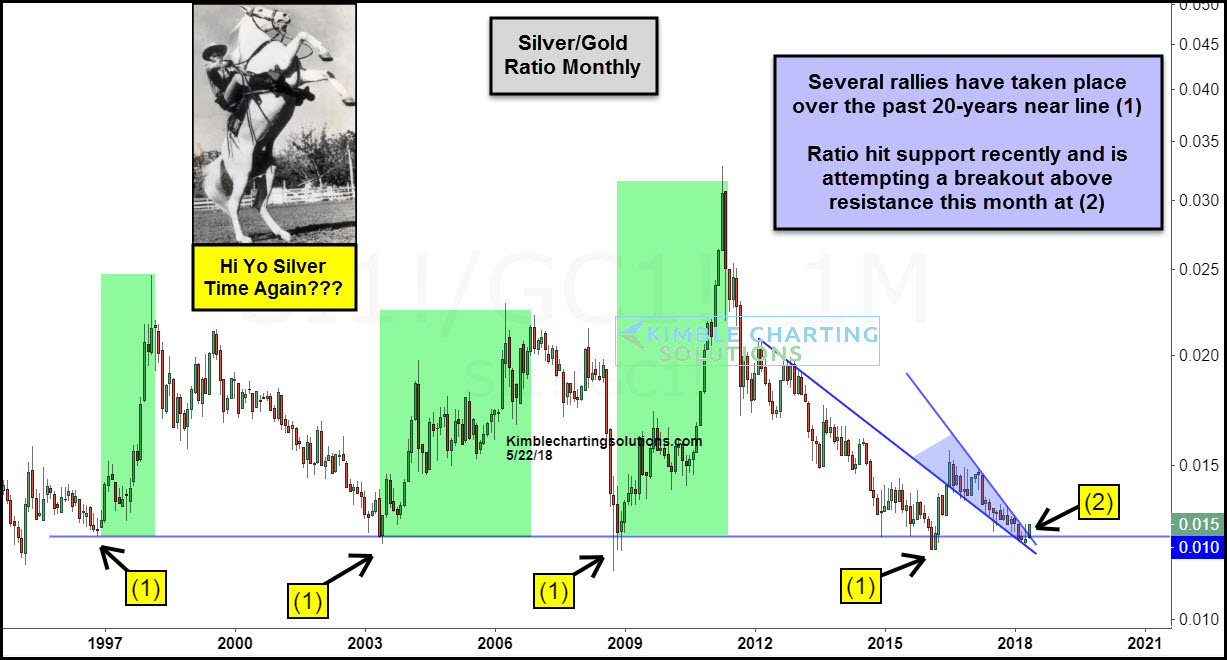
This chart looks at the Silver/Gold ratio on a monthly basis over the past 20-years. When the ratio is heading higher, Silver is stronger than Gold.
Since the 2011 highs, the majority of the time the ratio has been heading lower, reflecting the Silver is weaker than Gold.
Numerous times over the past 20-years the ratio has found line (1) to be support, where a rally in the ratio took place, reflecting strength in Silver overd Gold.
The decline over the past few years has the ratio testing support again near the apex of a potential bullish falling wedge.
So far this month the ratio is making an attempt to break above falling resistance at (2). If the ratio would continue to push higher, it could reflect an opportunity in the metals markets.
If you are interested in Gold, Silver, Mining stocks and Copper, we would be honored if you were a Metals Member.
CLICK HERE for sign up details or check out our most popular program.
-