The Ironic Way Bulls Should Play a New Sentiment Risk
"...the SPX closed at 2,579.36 on Nov. 1 after the Fed's decision to hold interest rates steady, and a rally immediately followed -- but the round 2,600 century mark held the post-FOMC rally in check. After a decline near the 2,550 mark, the SPX comes into this week trading back around its Nov. 1 close of 2,579.
"Headlines and rumors related to tax cuts may move the market one way or the other on any given day as Congress continues to debate reform, but until the next Fed decision in mid-December, we could continue to see the SPX experience choppy action around that Nov. 1 close just shy of 2,580, with support coming in at 2,550 and resistance at 2,600."
-- Monday Morning Outlook, November 20, 2017
RUT 1,500 is not only significant because it is a round number, but it's also a round 10% above last year's close. The near-term risk to bulls is the move through the respective SPX and RUT century marks proving to be only temporary, as selling accompanied the RUT's last move through 1,500 in October, and there was a notable hesitation at SPX 2,600 during last Tuesday and Wednesday's trading.
The Nasdaq Composite (IXIC - 6,889.16) experienced a breakout of its own, moving above a trendline connecting short-term peaks in mid-June, late July, and early November, and carving out new all-time closing highs in the process. The IXIC continues to maintain a dominant leadership role, despite being in an "overbought" condition, according to its 14-day Relative Strength Index (RSI) reading, for much of October and November.
Previously when IXIC has been overbought, as it is now, it has led to sideways action and modest pullbacks before the trend re-asserts itself. If a short-term pullback occurs, we would expect the first level of support to be in the 6,830 area, the site of the trendline connecting higher highs. A more severe decline could push the index to 6,725, site of a trendline connecting higher lows since mid-August.

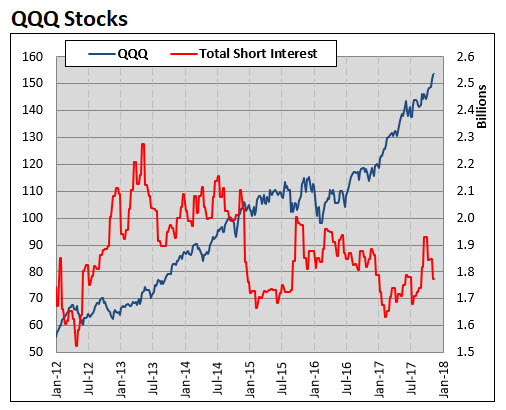
"In the most recent short interest report, there was finally a tick lower, after a relentless surge in recent reports. This decline in short interest is occurring from around the same level as what we saw prior to the November 2016 elections. I cannot say for certain whether the shorts will continue to cover -- but it does appear that many are playing a losing game, which increases the probability of short covering. Considering how the SPX behaved as it fought headwinds from a build in short interest, just think of its capabilities if the short-selling headwind turns into a short-covering tailwind."
-- Monday Morning Outlook, October 16, 2017
Short covering may have been at play in recent weeks, something that I postulated could happen in a mid-October commentary (excerpted above). Indeed, note in the three charts below that there has been net short covering in components of the SPX, RUT, and PowerShares QQQ Trust ETF (QQQ - 156.26).
Short covering will keep pullbacks in check, as we saw earlier this month, despite a spike in volatility. And short covering can certainly keep an uptrend intact. Remember, there was a plethora of shorts building positions even as the QQQ, SPX, and RUT rallied. To the extent these shorts are feeling pain, pullbacks may be viewed as an opportunity to exit and/or multi-month or all-time highs in an underlying could prompt such covering activity.


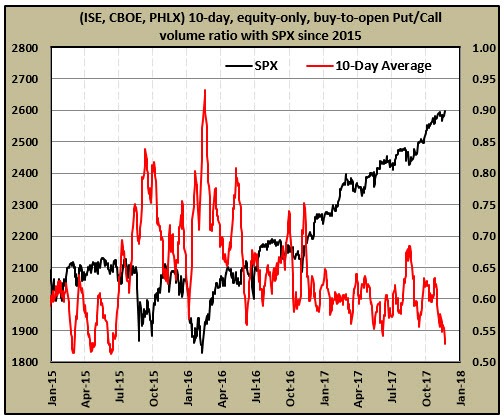
Above said, one indicator that caught my eye last week was in the options market, as equity option buyers purchased the greatest number of calls relative to puts since early 2015. Back then, the SPX was battling the 2,100 century mark, and it took more than a year before this level finally got taken out, amid two corrective moves in the interim. Considerable sideways movement occurred before the first correction, as you can see on the chart below.
Now, the SPX is doing battle with the 2,600 century mark as the 10-day, equity-only, buy-to-open put/call volume ratio is at a level that, two and a half years ago, preceded minimal upside relative to the downside action that took place. So, a continued risk for the bulls is equity option buyers being too enthusiastic about the upside prospects as key indexes do battle with big round numbers.
Ironically, for bulls, the best way to play this risk is through the purchase of call options. In other words, continue to play the uptrend in individual stocks that you like, especially if you find an outperforming equity with high short interest (and recent short-covering activity). Play the potential upside with call options on the equity, as calls allow you to leverage the upside in the stock's movement, with much less capital at risk relative to buying the equity. Since many companies have reported earnings in recent weeks, option premiums are much more attractive relative to their pre-earnings levels.
Continue reading:Indicator of the Week: The Best Time to Buy Stocks After Black FridayThe Week Ahead: Yellen Headlines Flurry of Fed Speeches