The periodic table of commodity returns
Jeff Desjardins on January 18, 2018![]()
If for some reason, you still think that the commodity markets are predictable, today's chart provides a nice piece of humble pie.
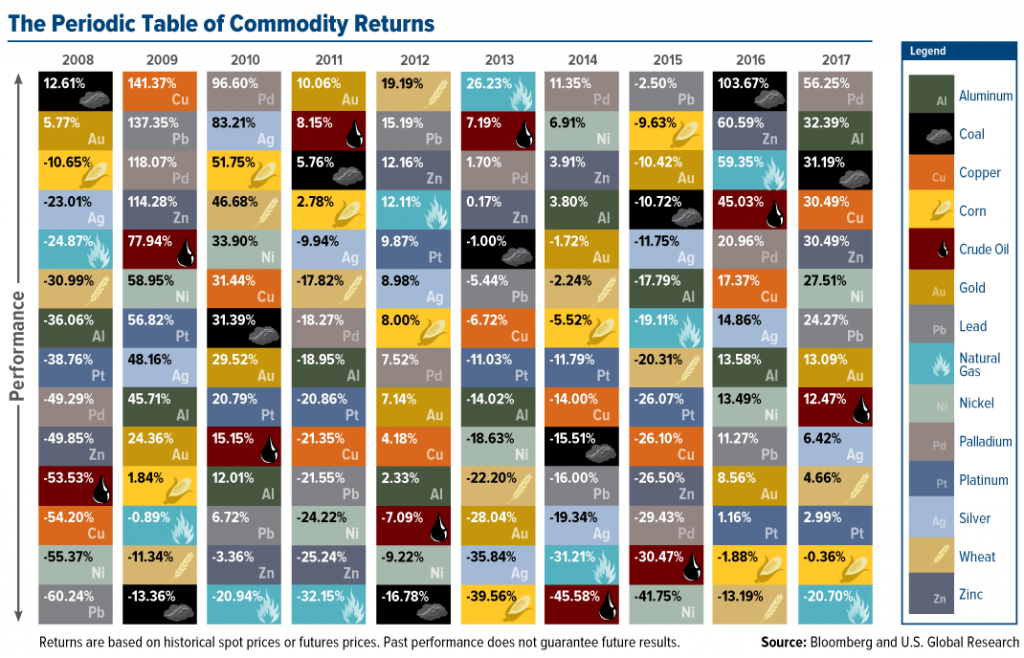
The Periodic Table of Commodity Returns, which comes to us annually from our friends at U.S. Global Investors, shows the returns of commodities over each year of the past decade.
As you may have guessed, commodities are a volatile asset class - and as a result, their respective rankings fluctuate wildly each year, making things really interesting for any observer.
The year in review
In 2017, we experienced the second full year of recovery from the collapse of commodities that plagued the dreaded stretch from 2011 to 2015.
Aside from natural gas (-20.7%), commodities were basically up across the board. The graphic, which focuses mostly on major commodity markets, has palladium (56.3%), aluminum (32.4%), coal (31.2%), copper (30.5%), and zinc (30.5%) as the big winners over the last year.
It's worth mentioning that some smaller markets are not included on the table - and battery metals like cobalt (133%) also did exceptionally well in 2017.
Deeper digging
If you are not yet thoroughly geeked out, there is an interactive version of this graphic as well. It allows you to sort by category, performance, or volatility.
Surprisingly, the least volatile substance on the table is gold:


While the gold market has been eerily quiet as of late, this is unexpected. That's because, at least compared to other financial assets like bonds or stocks, gold has quite the reputation for being volatile and risky.
But, when compared to other commodities, gold actually appears relatively tame.
What real volatility looks like
Here are the charts for natural gas and coal, each which much better represent a Dr. Jekyll / Mr. Hyde relationship.

Natural gas is in weird place.
It's a better alternative than coal or oil for emissions, but it's still a fossil fuel. This, along with the natural ebbs and flows of the oil and gas markets, have made gas particularly volatile over the last few years.

Of course, coal is falling out of favor in the long-term global energy mix - but that doesn't mean it can't get a shot in the arm from Chinese or Indian demand in the short term.
As a result, coal is all over the map on the Periodic Table of Commodity Returns, as well.