The Gold ETF Is Bottoming, Commodities Are Consolidating As The Dollar Remains Firm
The Gold Shares ETF is stabilizing above monthly and quarterly value levels of $111.60 and $110.26, respectively.
The commodities ETF has a negative weekly chart but is above its "reversion to the mean" and my annual value level.
The long dollar ETF has been rising around its "reversion to the mean" since the week of July 30, 2017.
Here are the weekly charts for the gold, commodities and dollar exchange-traded funds.
The gold trust ETF tracks the spot price of gold and is said to be backed by gold bars in vaults in London.
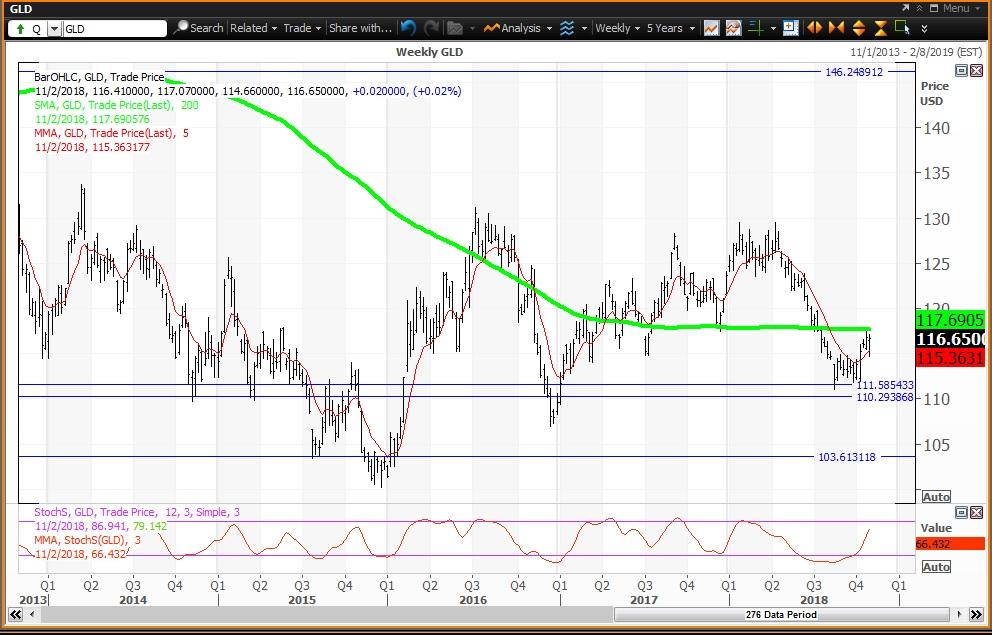
SPDR Gold Trust (NYSEARCA:GLD)
 Courtesy of MetaStock Xenith
The Gold ETF ($116.65 on Nov. 2) is down 5.7% year to date and its weekly chart remains positive with the ETF above its five-week modified moving average at $115.36 with its 200-week simple moving average or "reversion to the mean" at $117.69 which has been the high since the week of July 20. The 12x3x3 weekly slow stochastic reading rose to 66.43 last week, up from 56.18 on Oct. 26.
Investor Strategy: Buy weakness to my monthly, quarterly and semiannual value levels of $111.60, $110.26 and $103.62, respectively, and reduce holdings on strength to the 200-day simple moving average of $120.45. My annual risky level remains at $146.20.
The commodity ETF is heavily-weighted to energy by about 60%.
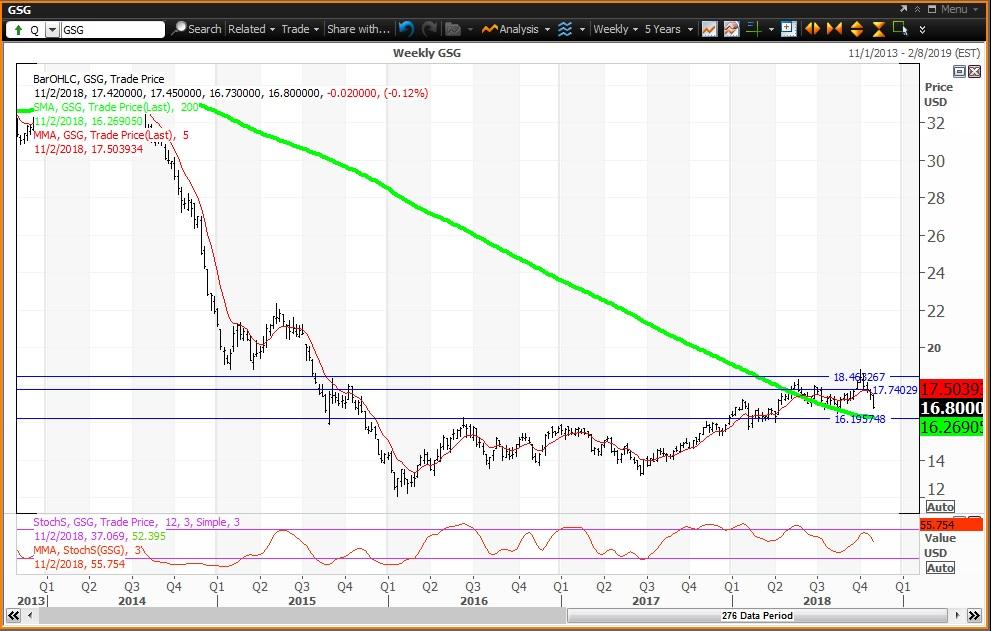
iShares S&P GSCI Commodity-Indexed Trust ETF (NYSEARCA:GSG)
 Courtesy of MetaStock Xenith
The Commodities ETF ($16.80 on Nov. 2) is up 3.2% year to date with a negative weekly chart. The ETF is below its five-week modified moving average of $17.50 and above its 200-week simple moving average or "reversion to the mean" at $16.27. The 12x3x3 weekly slow stochastic reading slipped to 55.75 last week, down from 65.10 on Oct. 26.
Investor Strategy: Buy GSG on weakness to my annual value level at $16.20. The ETF is below my quarterly and monthly pivots at $17.73 and $18.50, respectively.
Nymex crude oil has a negative weekly chart with the futures contract below its five-week modified moving average of $68.60. The 200-week simple moving average or "reversion to the mean" is $52.10. Crude oil is below my annual pivot of $63.81 with quarterly and monthly pivots at $73.87 and $75.58, respectively.
The US Dollar ETF is a basket of currencies that includes the dollar vs. Euro, Japanese Yen, British Pound, Canadian Dollar, Swedish Krona and Swiss Franc.
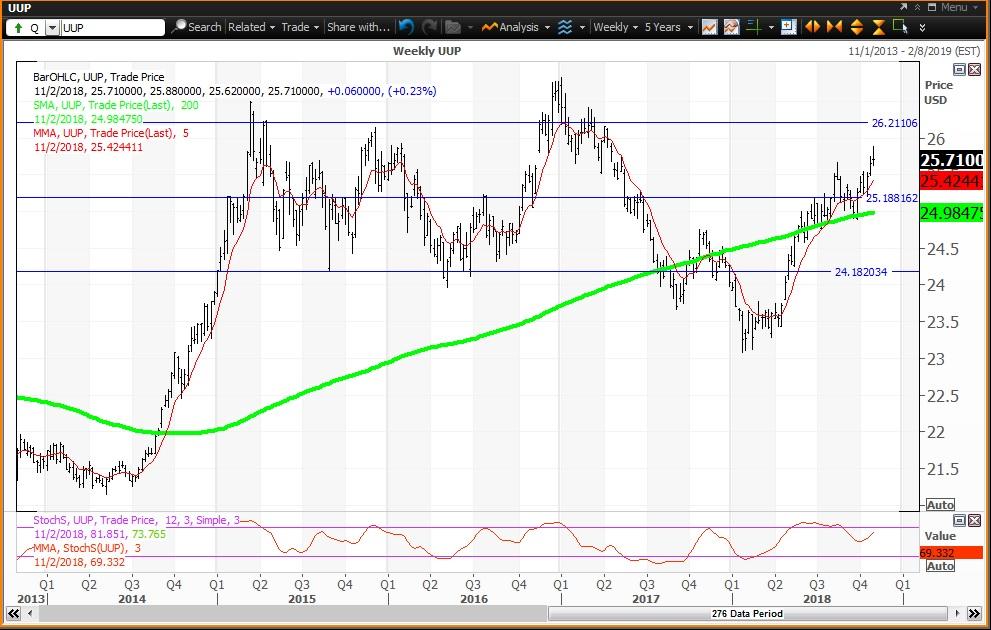
PowerShares DB US Dollar Index Bullish ETF (NYSEARCA:UUP)
 Courtesy of MetaStock Xenith
The Dollar ETF ($25.71 on Nov. 2) is up 7% year to date and has a positive weekly chart with the ETF above its five-week modified moving average of $25.42 after recent weakness held its 200-week simple moving average or "reversion to the mean" of $24.98. The 12x3x3 weekly slow stochastic reading rose to 69.33 last week up from 63.07 on Oct. 26.
Investor Strategy: Buy weakness to my annual value level at $24.18 and reduce holdings on strength to my semiannual risky level of $28.65. The ETF is above my monthly and quarterly pivots at $26.20 and $25.20, respectively.
Disclosure: I/we have no positions in any stocks mentioned, and no plans to initiate any positions within the next 72 hours.
I wrote this article myself, and it expresses my own opinions. I am not receiving compensation for it (other than from Seeking Alpha). I have no business relationship with any company whose stock is mentioned in this article.
Follow Richard Suttmeier and get email alerts