A Climbing USDX Means Gold Investors Should Care / Commodities / Gold and Silver 2021

Positions in the USDX are shiftingfrom shorts to longs, so gold investors should look closely. Why? Because it’san inverse relationship.
We’ve discussed the negative correlationbetween the dollar and the precious metals many times before, but it can neverbe discussed enough, particularly as the situation develops and the outlook forthe USD Index becomes more positive.
Once the USD Index lands some knockoutpunches, the precious metals will be hurting, as they tend to do when thedollar rises. Gold, silver and the miners will eventually rise, but for themedium-term, they are still in bearish territory.
Counted out, counted down and rarelycounted on, investors threw in the USD Index’s towel long before the fight evenbegan. However, after shaking the cobwebs and landing a few haymakers, thegreenback’s Rocky-like comeback is proof that ‘it ain’t over till it’s over.’
Let’s look at the factors influencingrise of the USD Index as well as some of the historical patterns:
1.Repositioning from Short to Long
Now, with thousands of screaming fanschanting “USD, USD,” the eye of the tiger could be eying another move higher.As evidence, if you analyze the chart below, you can see that non-commercial(speculative) traders have quietly repositioned from net-short to net-long.
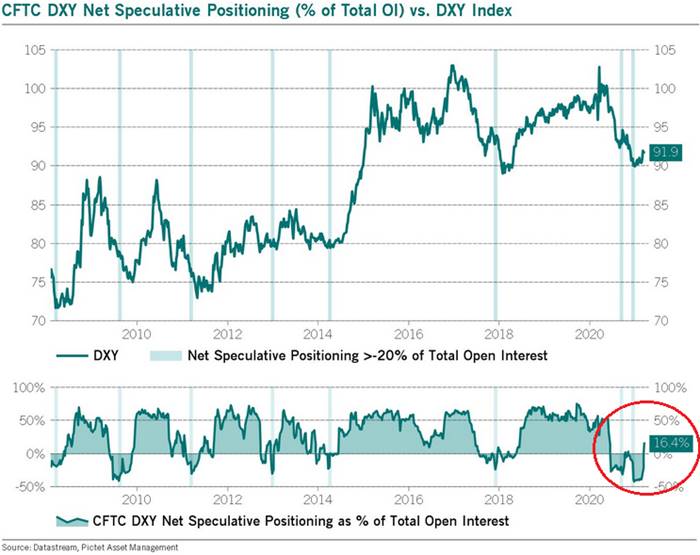
To explain, notice how oversold periodsin 2014 and 2018 – where net-speculative short interest as a percentage of totalopen interest was extremely high – preceded sharp rallies in the USD Index?Thus, with 2021 the most extreme on record, the forthcoming rally should be significant.
How significant? Well, let’s take a lookat how things developed in the past – after all, history tends to rhyme.
Let’s focus on what happened when the netspeculative positions were significantly (!) negative and then they becamesignificantly (!) positive, so without paying attention to tiny moves (like theone that we saw last summer), let’s focus on the more meaningful ones (like theone that we see right now – the net positions just became visibly positive –over 16%, after being very negative for quite some time.
In short, that’s how the followingprofound rallies started:The big 2008 rally (over 16index points)The big 2009 – 2010 rally (over14 index points)The 2011 – 2012 rally (over 11index points)The 2013 rally (“only” over 5index points)The big 2014 – 2015 rally (over20 index points)The 2018 rally (over 15 indexpoints)
The current rally started at about 89,so if the “normal” (the above shows what is the normal course of action)happens, the USD Index is likely to rally to at least 94, but since the 5-indexpoint rally seems to be the data outlier, it might be better to base the targeton the remaining 5 cases. Consequently, one could expect the USD Index to rallyby at least 11 – 20 index points, based on the net speculative positions alone.This means the upside target area of about 105 – 114.
Consequently,a comeback to the 2020 highs is not only very likely, but also the conservativescenario.
2.The 10-Year Treasury Yield
Adding to the momentum, in 2020, the USDIndex sat out the U.S. 10-Year Treasury yield’s ferocious upswing. Defyinghistorical precedent, a bottom and subsequent move higher in the U.S. 10-YearTreasury yield has coincided with a rise in the USD Index 80% of the time since 2003 . But now in sync, 2021 has been a muchdifferent story. If you analyze the chart below, you can see that the USD Indexhas been moving in lockstep with the U.S. 10-Year Treasury yield since the NewYear.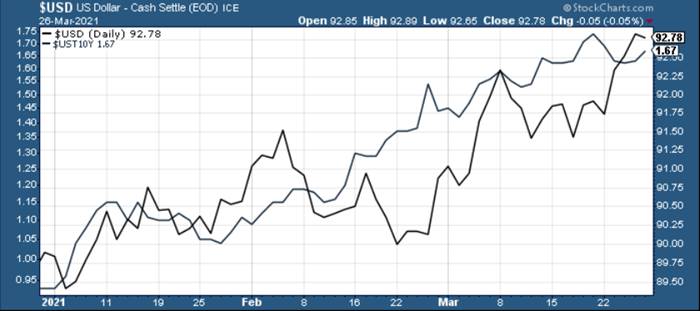
3.Reclaiming 200-Day Moving Average
In addition, not only has the USD Indexbroke above its previous highs, but the basket just reclaimed its 200-day moving average (which is oftenindicative of a long-term uptrend). As a result, the greenback continues to float like a butterfly and sting like a bee .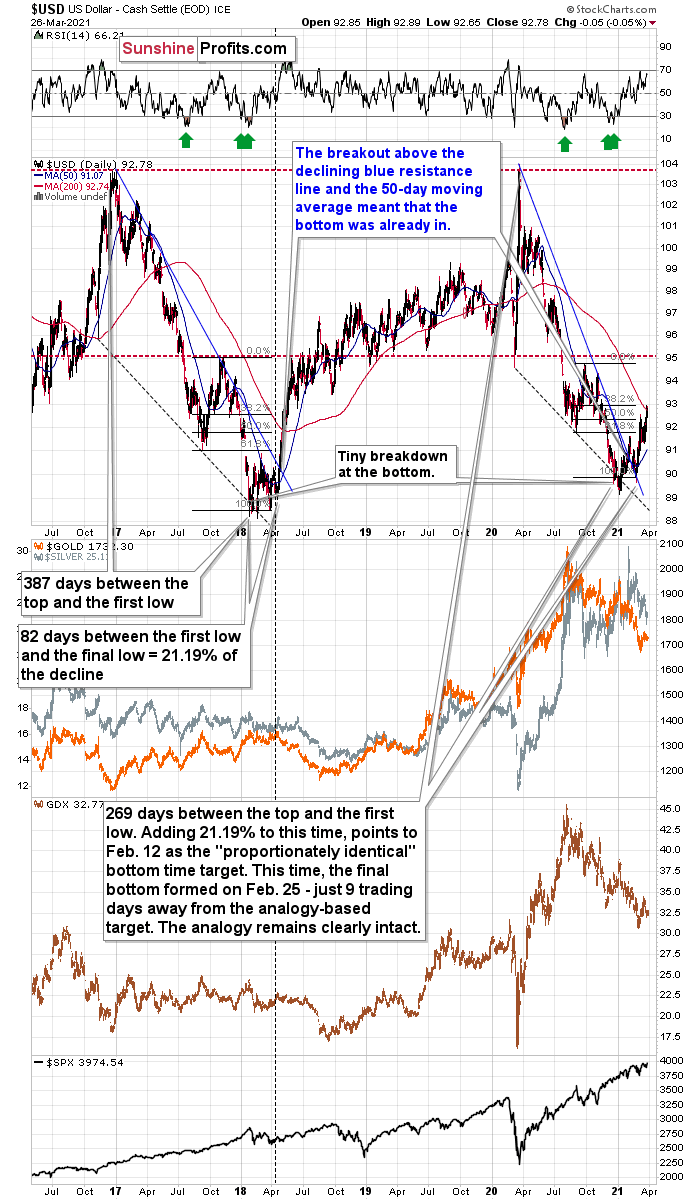
For historical context, after recapturingits 200-day MA in 2018, the USD Index only suffered mild pullbacks beforesurging above 95. As such, with the mid-2020 highs the USD Index’s nextopponent, 94.5 is unlikely to put up much of a fight.
Keepin mind though: in the very-short term, the USD Index could move lower andretest its prior 2021 highs. However, the damageshould be minimal, and it wouldn’t invalidate the USD Index’s medium-termbreakout. Because of this, the outlook remains profoundly bearish for the gold, silver , and mining stocks over the medium term. If you analyze the table below, youcan see that the preciousmetals tend to move inversely to the U.S. dollar.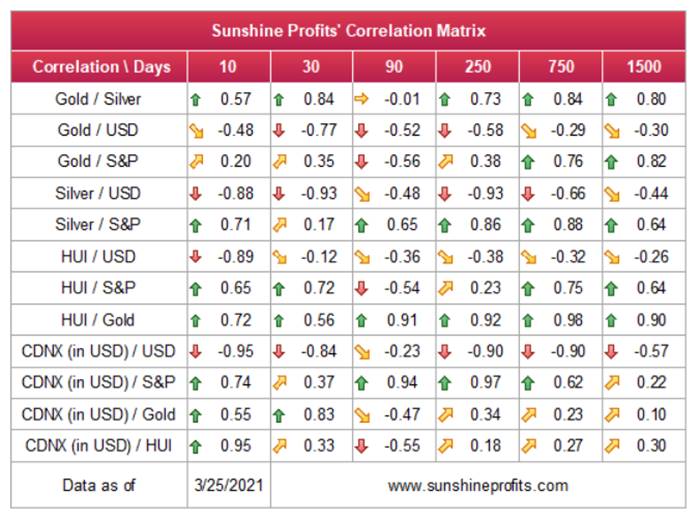
4.The History Really Rhymes: The 2017-2018 Upswing
But saving the best for last, the2017-2018 analogue could be the USD Index’s knockout punch. With this versionlikely to be titled “The Resurgence: Part 2,” while history often rhymes, it’s rare for it to rhyme with this levelof specificity .
Please see below: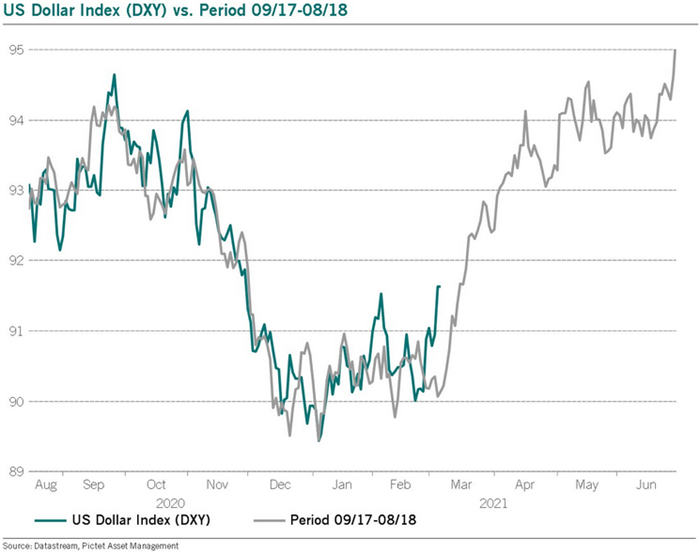
Even more revealing, while it took lessthan 118 days for the USD Index to move from peak to trough in 2020-2021, theuprising could occur at a much faster pace. In 2018, the USD Index’s breakoutabove its 50-day moving average is exactly what added gasoline to the USDX’s2018 fire. And after the 2018 breakout, the USDX surged back to its previoushigh. Today, that level is 94.5 .
Furthermore, in 2017-2018, it also took82 days for the USDX to form a final bottom (the number of days between theinitial bottom and the final bottom) and the duration amounts to 21.19% of theoverall timeframe. If we applied a similar timeframe to today’s move, then theUSD Index should have bottomed on Feb. 12. It actually bottomed (finally) onFeb. 25, which was just 8 trading days away from the former date. Taking intoaccount the sizes of the moves that preceded the previous declines (they tookapproximately one year to complete), this is extremely close and an excellentconfirmation that the self-similar pattern remains intact.
Also noteworthy, as the USDX approachedits final bottom in 2017-2018, gold traded sideways. Today, however, goldhas been in a downward spiral and it doesn’t seem that the decline is over. Froma medium-term perspective, the yellow metal’s behavior is actually more bearishthan it was in 2017-2018.
And while the self-similar pattern isalready playing out as predicted, please read below for further explanation asto why the USD Index’s current and historical price action remains a spittingimage:
It’snot true that there were no pullbacks during the 2018 rally. There were, butthey were simply too small to be visible from the long-term point of view.
Thefirst notable pullback took place in early May 2018, and it contributed to acorrective upswing in the precious metals market. To be precise, the USD Indexdeclined after rallying for 56 trading days, but gold rallied earlier – 51trading days after the USD Index’s final bottom. The USDX’s immediate-topformed 16 trading days after its final bottom, and gold’s bottom formed 10trading days after the USD’s final bottom.
Comparingthis to the size of the previous decline in terms of the trading days, it was:
Also indicating a messy divorce, whenthe USD Index turned a short-term decline into consolidation in mid-2018, canyou guess what happened next? Well, the USD Index moved significantly higher,while gold moved significantly lower.
Please see below: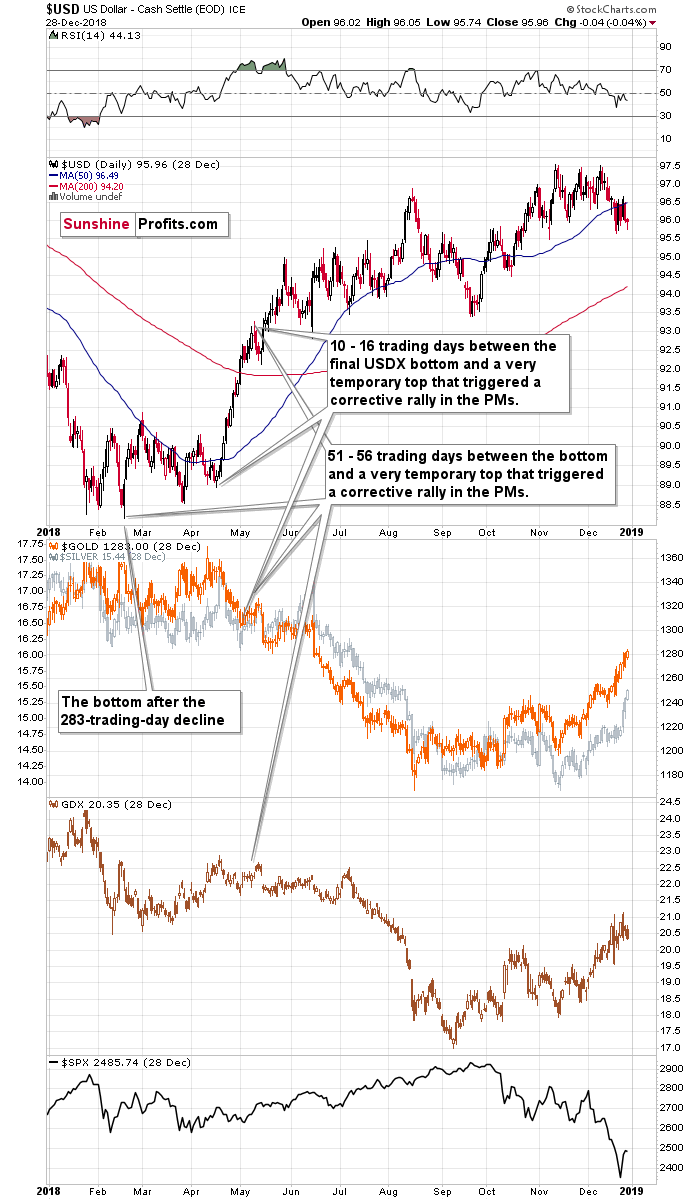
Moreover, when comparing the pairs’behavior in mid-2018 to today, it’s ominously similar.
Please see below: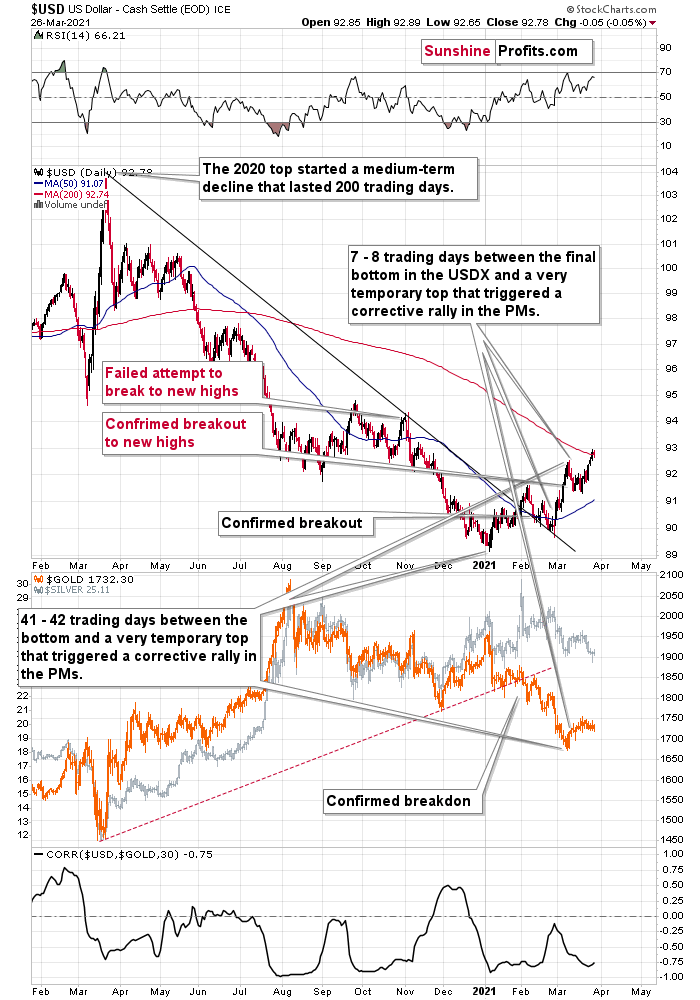
For additional context, I also wrote onMar. 10:
Let’sexamine the current situation: the preceding decline lasted for 200 trading days and therewere 41 – 42 trading days betweenthe final USDX bottom and the short-term reversals in gold and USDX. Comparingthis to the final USDX bottom, we get 7 – 8 trading days.
Applyingthe previous percentages to the length of the most recent medium-term declinein the USD Index provides us with the following:
Theabove estimation of about 36 – 40 trading days almost perfectly fits thecurrent 41 – 42-day delay, and the estimation of about 7 – 11 trading daysalmost perfectly fits the current delay of 7 – 8 trading days.
Inother words, the analogy to the 2018 performance does not only remain intact –it actually perfectly confirms the validity of the current corrective upswing.Once again, it’s very likely just a pullback, not a big trend reversal.
Likewise, a potentially bearish patternthat I have been monitoring – where the USD Index’s price action from July toOctober 2020 mirrored the price action from December 2020 to February/March2021– has officially been broken .With the USD Index’s medium-term breakout trumping the former, the potentiallybearish pattern has been invalidated and the USD Index is likely to continueits ascension.
But to what end?
Well, if we look back at 2020, the USDIndex attempted to recapture its previous highs. But lacking the upwardmomentum, the failure was followed by a sharp move lower. Today, however, theUSD Index has broken above its previous highs and the greenback verified thebreakout by consolidating, moving back toward the previous lows and rising onceagain. Now, the USD Index is visiblyabove its previous highs .
Taken together, and given the magnitudeof the 2017-2018 upswing , ~94.5 islikely the USD Index’s first stop. And in the months to follow, the USDX willlikely exceed 100 at some point over the medium or long term.
In conclusion, the USD Index went frombeing on the ropes to winning the crowd. And with the momentum building and theadrenaline rising, it’s only a matter of time before the USD Index landsanother haymaker. Moreover, given the precious metals’ negative correlationwith the U.S. dollar – combined with the fact that technicals, fundamentals andsentiment are now riding with the greenback – an uprising could leave the gold,silver, and mining stocks battered and bruised. However, after a tough periodof soul searching, the precious metals will regain the heavyweight championshiponce again. Or, if one wants to put it in more technical terms, gold, silver,and miners are likely to start a massive rally, but only after decliningvisibly first.
Thankyou for reading the above free analysis. It’s part of today’s extensive Gold& Silver Trading Alert. We encourage you to sign up for our free goldnewsletter – as soon as you do, you'll get 7 days of free access to our premiumdaily Gold & Silver Trading Alerts and you can read the full version of theabove analysis right away. Signup for our free gold newsletter today!
Thank you.
Przemyslaw Radomski, CFA
Founder, Editor-in-chief
Toolsfor Effective Gold & Silver Investments - SunshineProfits.com
Tools für EffektivesGold- und Silber-Investment - SunshineProfits.DE
* * * * *
About Sunshine Profits
SunshineProfits enables anyone to forecast market changes with a level of accuracy thatwas once only available to closed-door institutions. It provides free trialaccess to its best investment tools (including lists of best gold stocks and best silver stocks),proprietary gold & silver indicators, buy & sell signals, weekly newsletter, and more. Seeing is believing.
Disclaimer
All essays, research and information found aboverepresent analyses and opinions of Przemyslaw Radomski, CFA and SunshineProfits' associates only. As such, it may prove wrong and be a subject tochange without notice. Opinions and analyses were based on data available toauthors of respective essays at the time of writing. Although the informationprovided above is based on careful research and sources that are believed to beaccurate, Przemyslaw Radomski, CFA and his associates do not guarantee theaccuracy or thoroughness of the data or information reported. The opinionspublished above are neither an offer nor a recommendation to purchase or sell anysecurities. Mr. Radomski is not a Registered Securities Advisor. By readingPrzemyslaw Radomski's, CFA reports you fully agree that he will not be heldresponsible or liable for any decisions you make regarding any informationprovided in these reports. Investing, trading and speculation in any financialmarkets may involve high risk of loss. Przemyslaw Radomski, CFA, SunshineProfits' employees and affiliates as well as members of their families may havea short or long position in any securities, including those mentioned in any ofthe reports or essays, and may make additional purchases and/or sales of thosesecurities without notice.
Przemyslaw Radomski Archive |
© 2005-2019 http://www.MarketOracle.co.uk - The Market Oracle is a FREE Daily Financial Markets Analysis & Forecasting online publication.