All Signs Point To A Much Higher Price For Gold
The breakout in June was a significant event.
The Fed and ECB kept the bullish party going in July.
Validation of the bull market comes from the global currency markets.
Gold could reach $2000 per ounce a lot sooner than most market participants believe.
Gold mining stocks will magnify the move - the GDXJ ETF has explosive potential.
For anyone who appreciates history, gold is an asset that has captured the attention of humans for thousands of years. Long before there were dollars, euros, yen, rubles, yuan, or any of the other currencies that circulate around the globe today, gold was money. Gold is not only a traditional means of exchange; it continues to play a prominent role in the world financial system. Central banks, governments, monetary authorities, and even supranational institutions like the International Monetary Fund all hold gold as a reserve asset. While the official sector leaders who are responsible for managing the assets of nations seldom talk about gold, they have been net buys of the metal over the past years.
The last significant official sector sale came at the turn of this century. The Bank of England, under the Chancellor of the Exchequer Gordon Brown, sold around three hundred tons of gold at prices below $300 per ounce. The hub of the international gold market is in London, so the sale had a symbolic tone. At the time, some people, including government officials, believed that the precious metal was nothing more than a barbarous relic of the past. They thought gold was an uncivilized and primitive form of money and preferred to hold the legal tender of nations than the yellow metal. Less than two decades later, the price is over $1400 per ounce. At around five times the amount the UK received for half its treasure; gold has broken out to the upside. Technically, it looks like it is just a matter of time before the price rises to another all-time peak above the 2011 high at $1920.70 per ounce.
If gold is heading for $2000 per ounce or higher, junior gold mining companies that explore for the metal and have a leveraged position when it comes to production, are likely to outperform the yellow metal on the upside. The VanEck Vectors Junior Gold Miners ETF product (GDXJ) can magnify the performance of the precious metal if the price is ready to surge to the upside.
The breakout in June was a significant event
Gold broke out of a $331.30 trading range that had contained the price since 2014 in June.
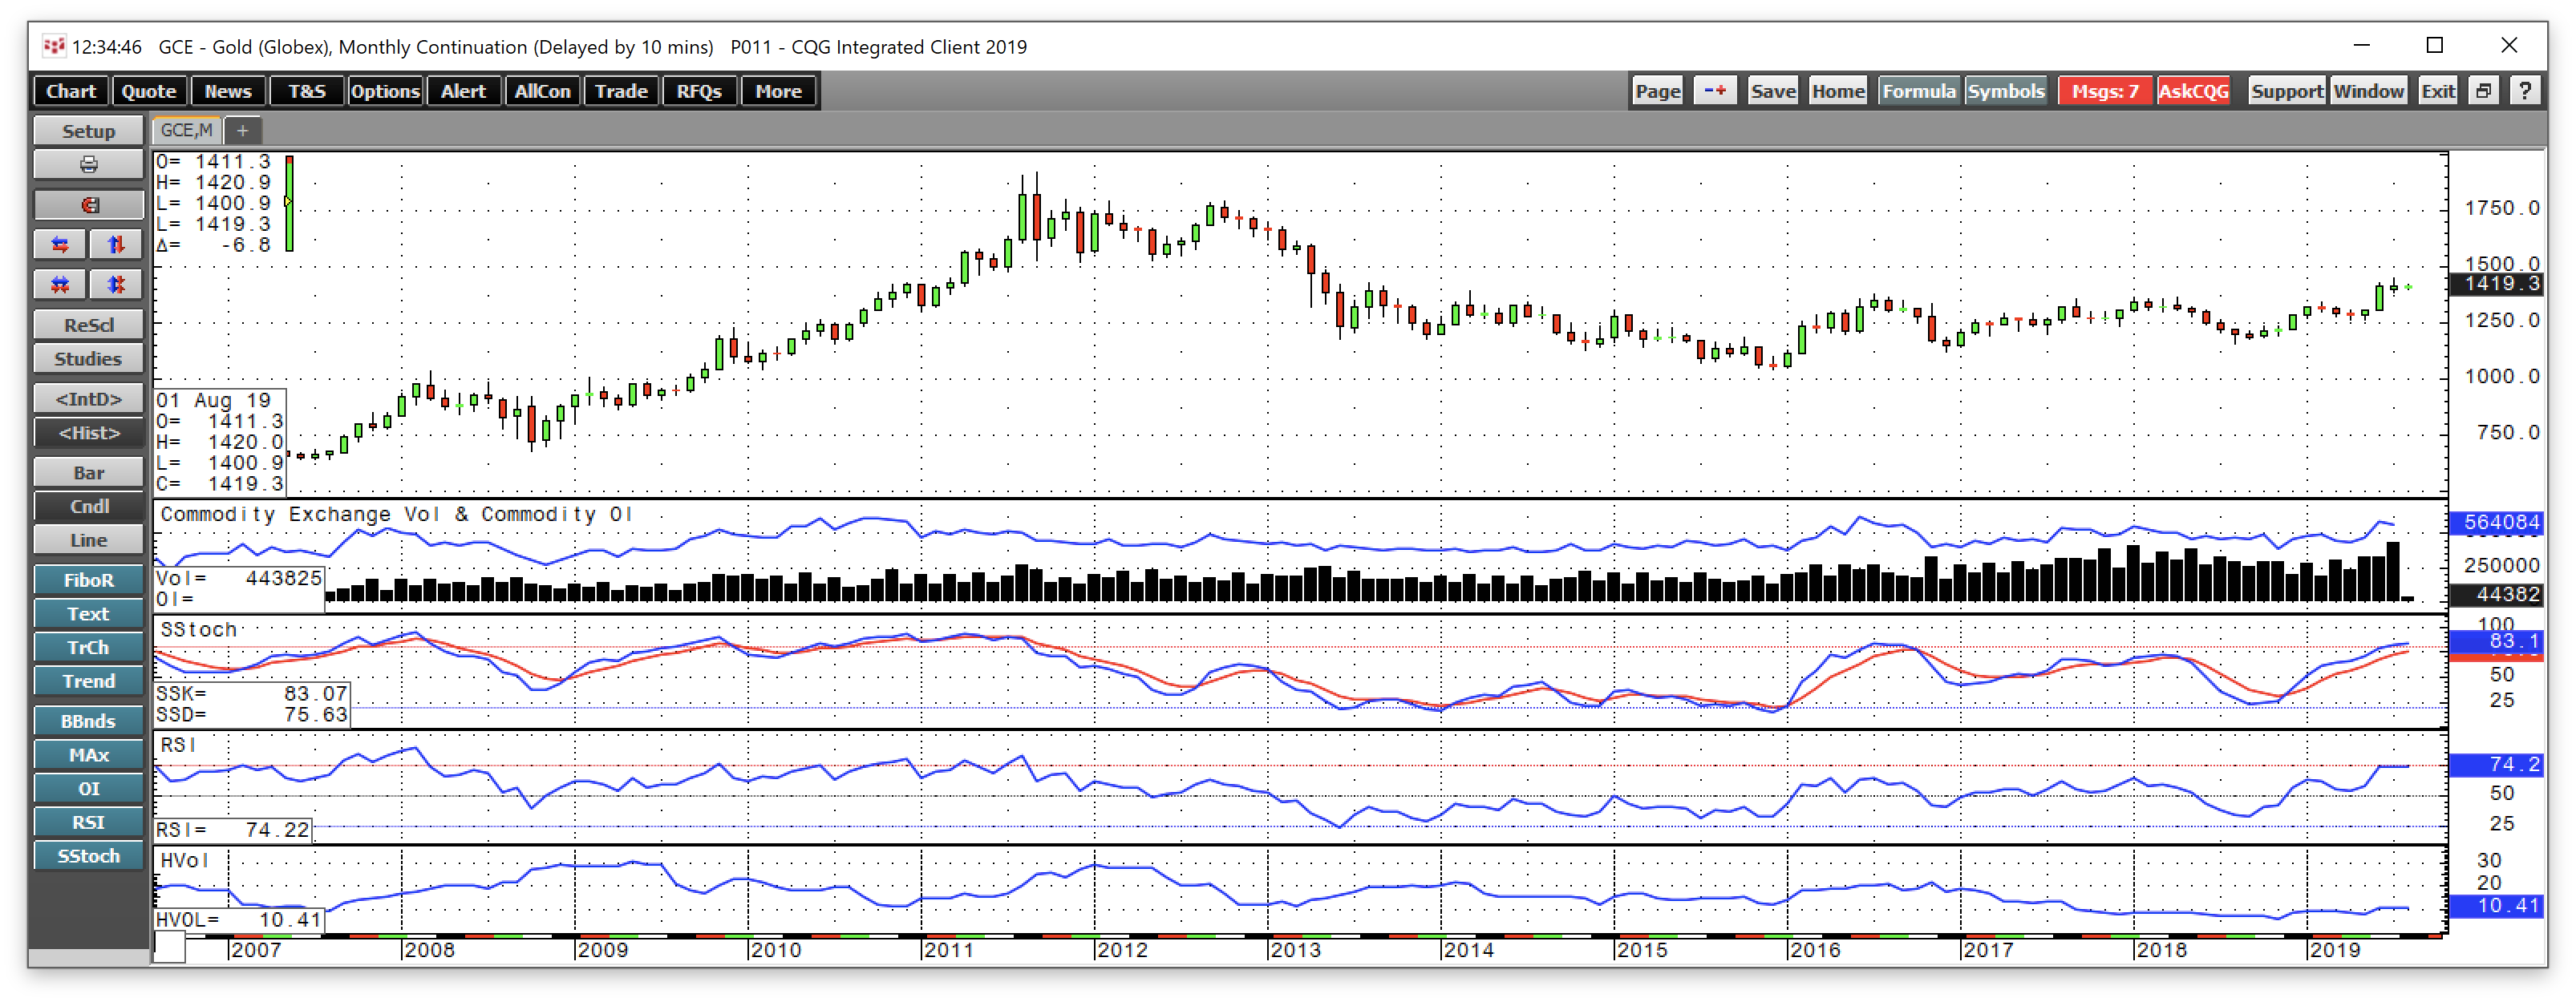
Source: CQG
The monthly chart shows that the price of gold rose above the July 2016 high at $1377.50 following the June Fed meeting when the central bank told markets that interest rates in the US would be heading lower before the end of 2019. Both price momentum and relative strength indicators are in overbought territory, but the metrics continue to rise on the long-term chart. Open interest or the total number of open long and short positions in the COMEX futures rose with the price. Higher open interest and the increasing price is typically a technical validation of a bullish trend in a futures market. Meanwhile, at 10.41%, monthly historical volatility shows that the rally is slow and steady, which can be a supportive factor.
The Fed and ECB kept the bullish party going in July
In July, the European Central Bank told markets that sluggish economic conditions in Europe are likely to cause the ECB to reduce interest rates and perhaps reinstitute quantitative easing. Purchasing debt securities pushes rates lower further out along the yield curve. With short-term European rates at negative forty basis points, ECB President Mario Draghi said there is some room for them to fall further. After all, short-term rates in Switzerland are already at the negative 75 basis point level.
The US central bank met on July 31 and lowered the short-term Fed Funds rate by 25 basis points to 2.00-2.25%. They also ended the program of balance sheet normalization, which will take the upward pressure off US rates further out along the yield curve. The dovish shift in the US and more accommodative monetary policy moves in Europe are bullish factors for the gold market. As central banks continue to provide stimulus in the form of a flood of liquidity, the purchasing power of fiat currencies is likely to continue to fall when compared to the world's oldest means of exchange, which is gold. The yellow metal is an integral part of central bank holdings, and they have been net buyers of the metal over the recent years. Central banks can print more money and lower rates, but they cannot create more gold. The rare metal is likely to benefit from the trend in monetary policy, which has the potential to keep the bullish party going in the gold market. The selling in gold following the July Fed meeting was a function of disappointment that that central bank did not go further. However, it may have created another buying opportunity in gold as it is a hybrid between a commodity and a currency instrument.
Validation of the bull market comes from the global currency markets
The price of gold took off to the upside in 2004 in dollar terms. In 2008, it rose above the $900 level for the first time in modern history.
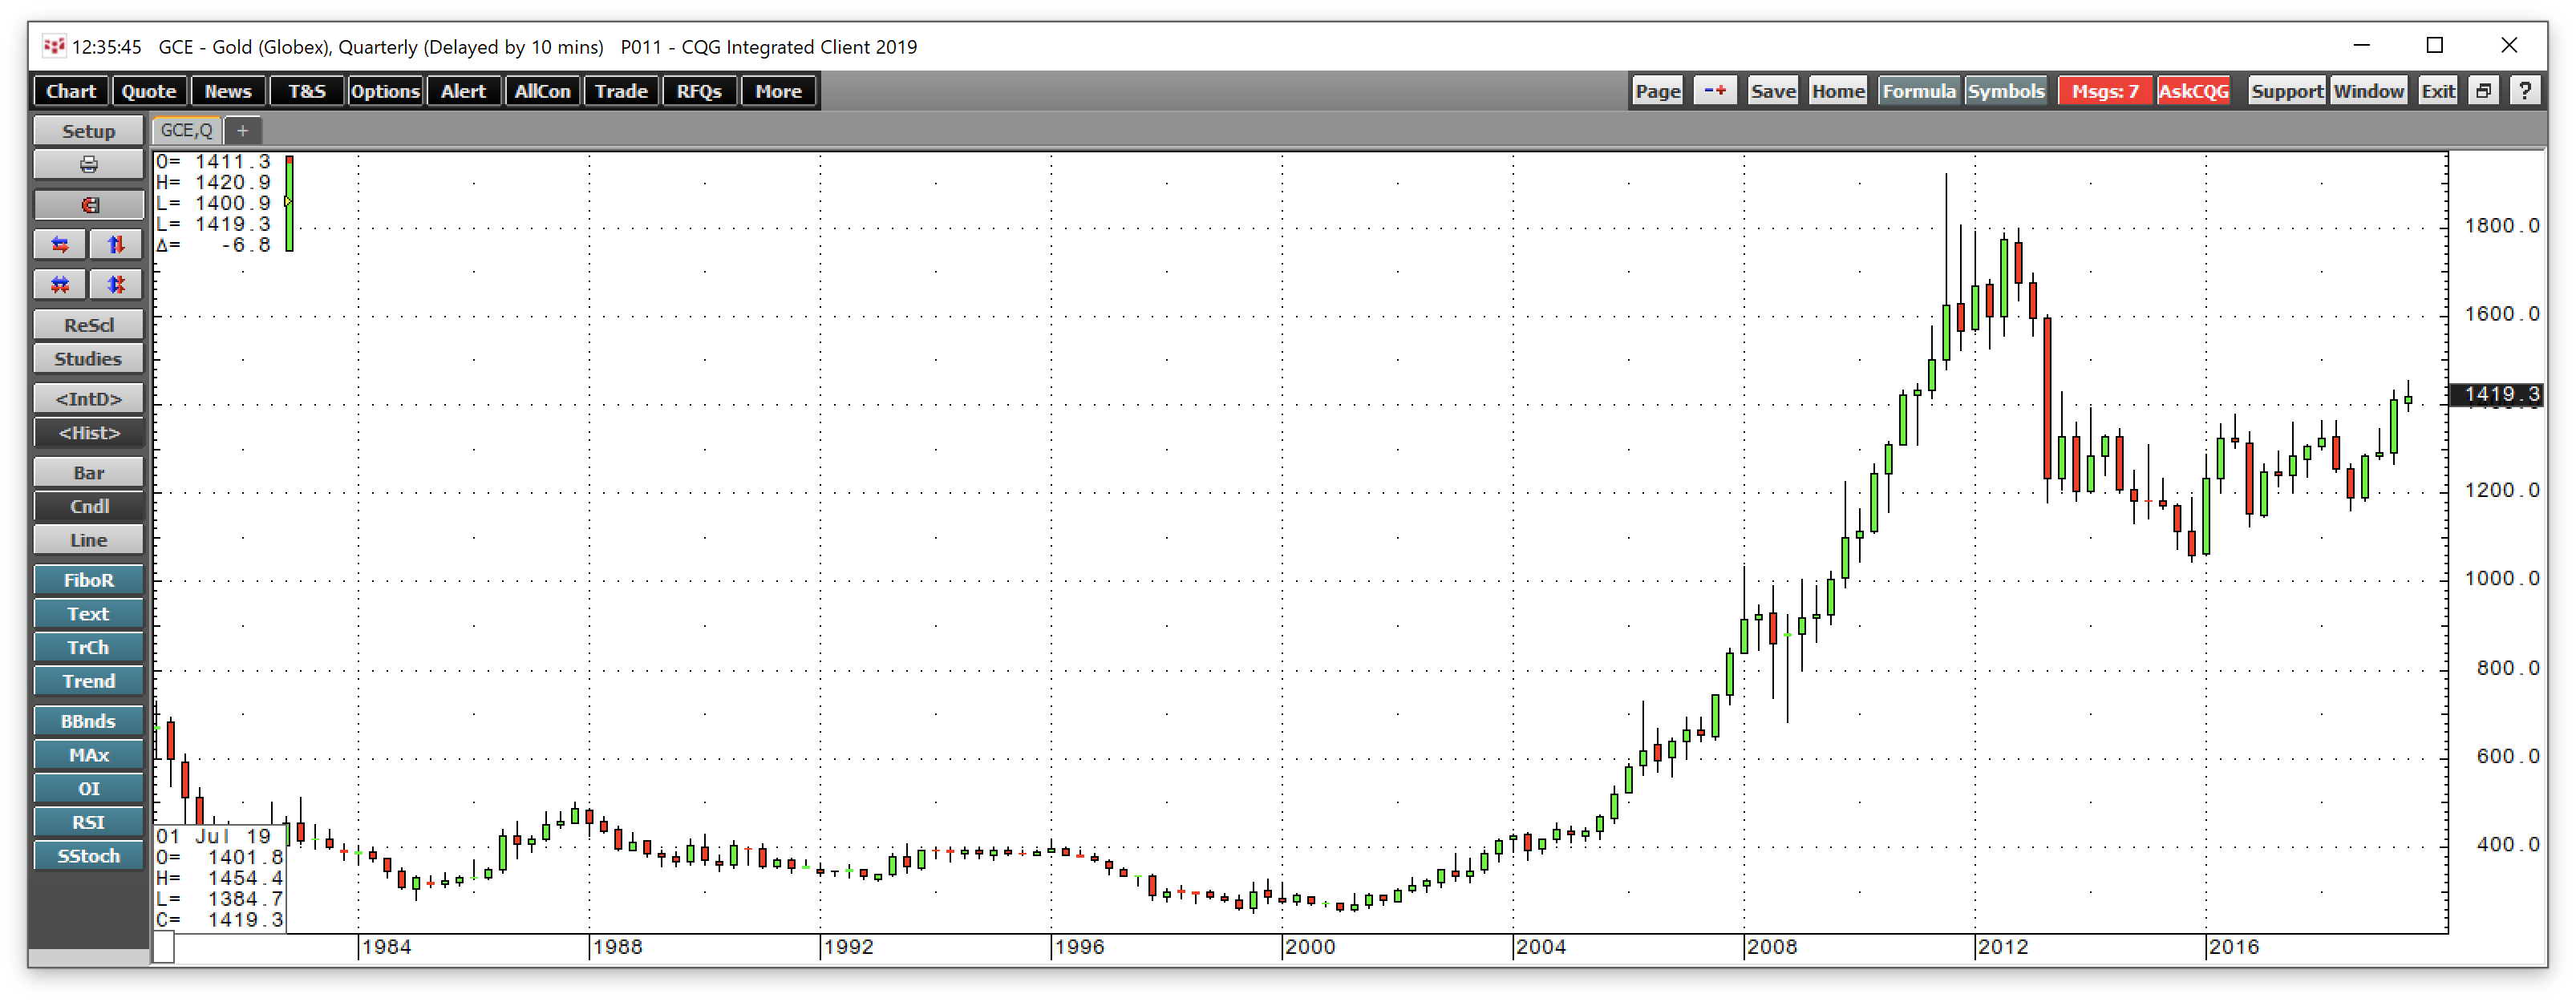
Source: CQG
The quarterly chart shows that gold rose to the all-time high at 1920.70 in 2011. The correction took the price to a bottom at $1046.20 in late 2015. The move to the upside in June represented a technical break to the upside that could eventually lead to a challenge of the 2011 peak.
Gold has a long-term inverse price relationship with the US dollar, but it has not only appreciated in US dollar terms.
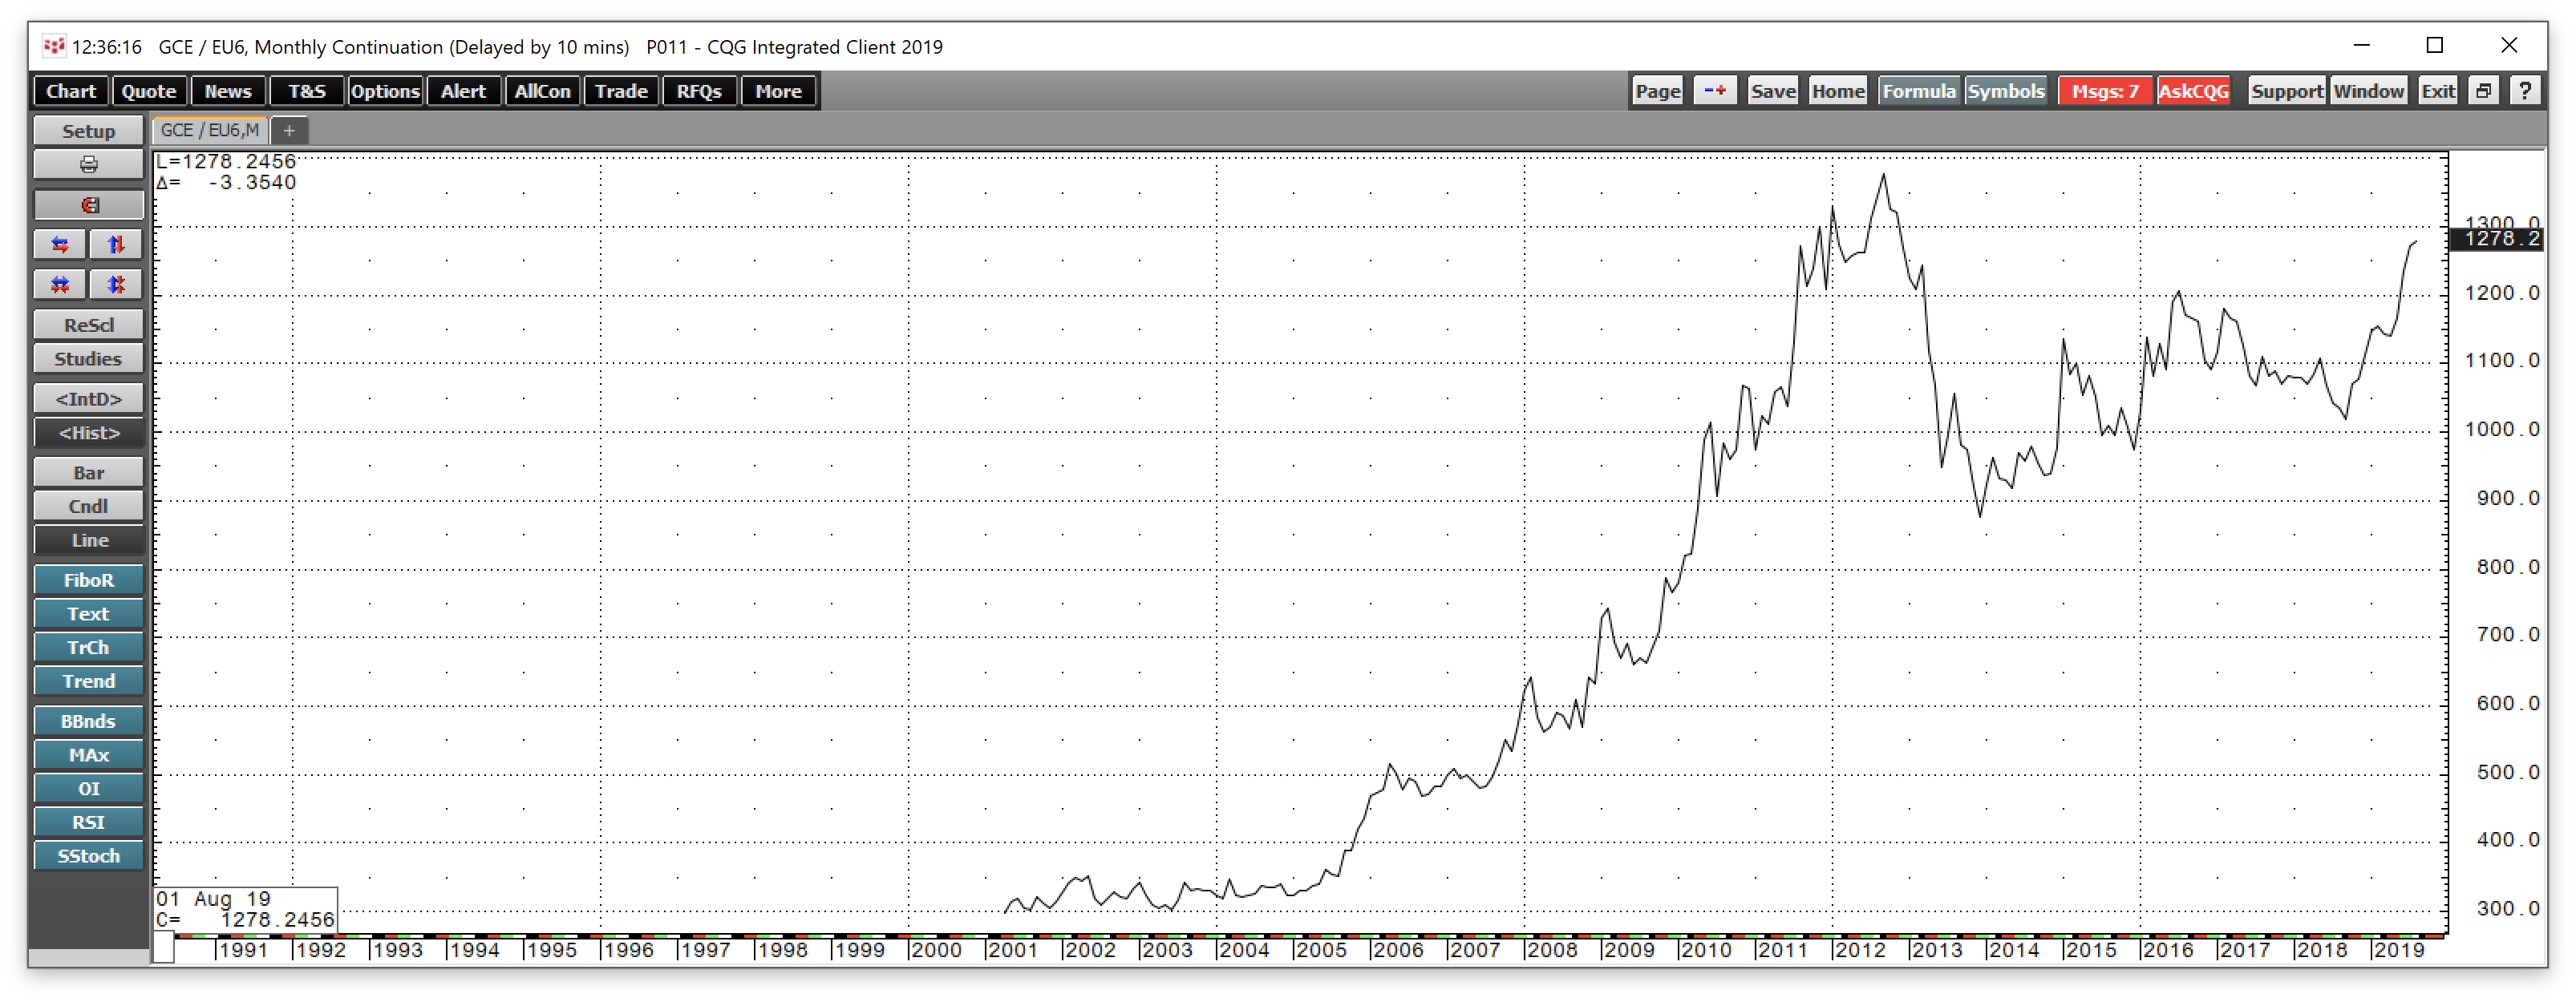
Source: CQG
The monthly chart of gold in euro terms shows that the bull market began in 2005. Gold reached a high at 1376.88 euros in 2012, and at 1278.20 euros per ounce on August 1, it is approaching the high. Gold is closer to the record level in euros than it is in dollars. Then yellow metal has also been climbing in Swiss franc terms.
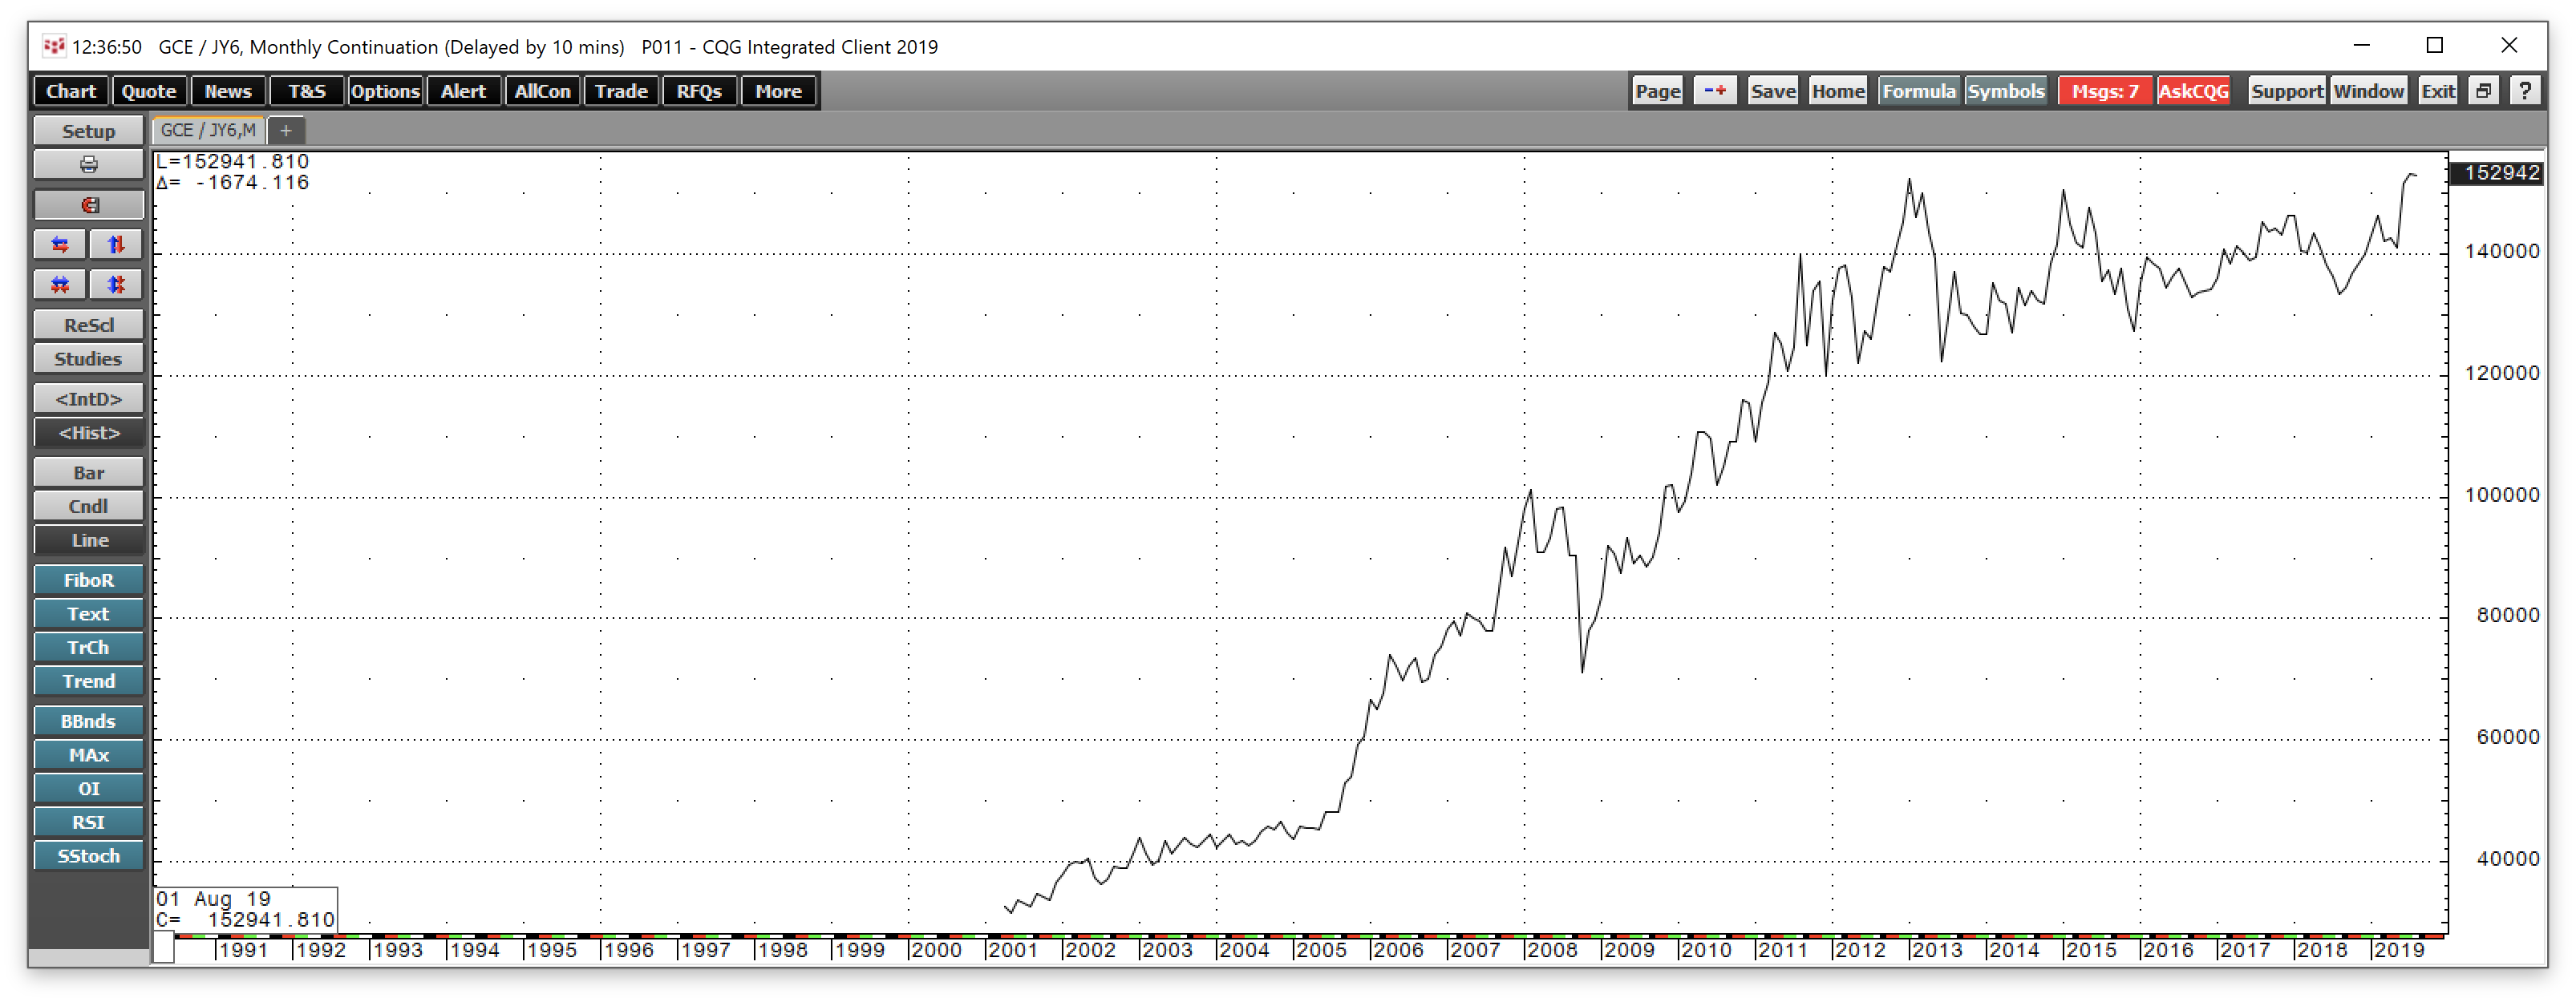
Source: CQG
The Japanese yen is also a reserve currency, and in yen terms, gold has already reached a new record level. At 152,942 yen per ounce, the price has already climbed above the previous peak from 2013 at 152,457 yen per ounce.
Source: CQG
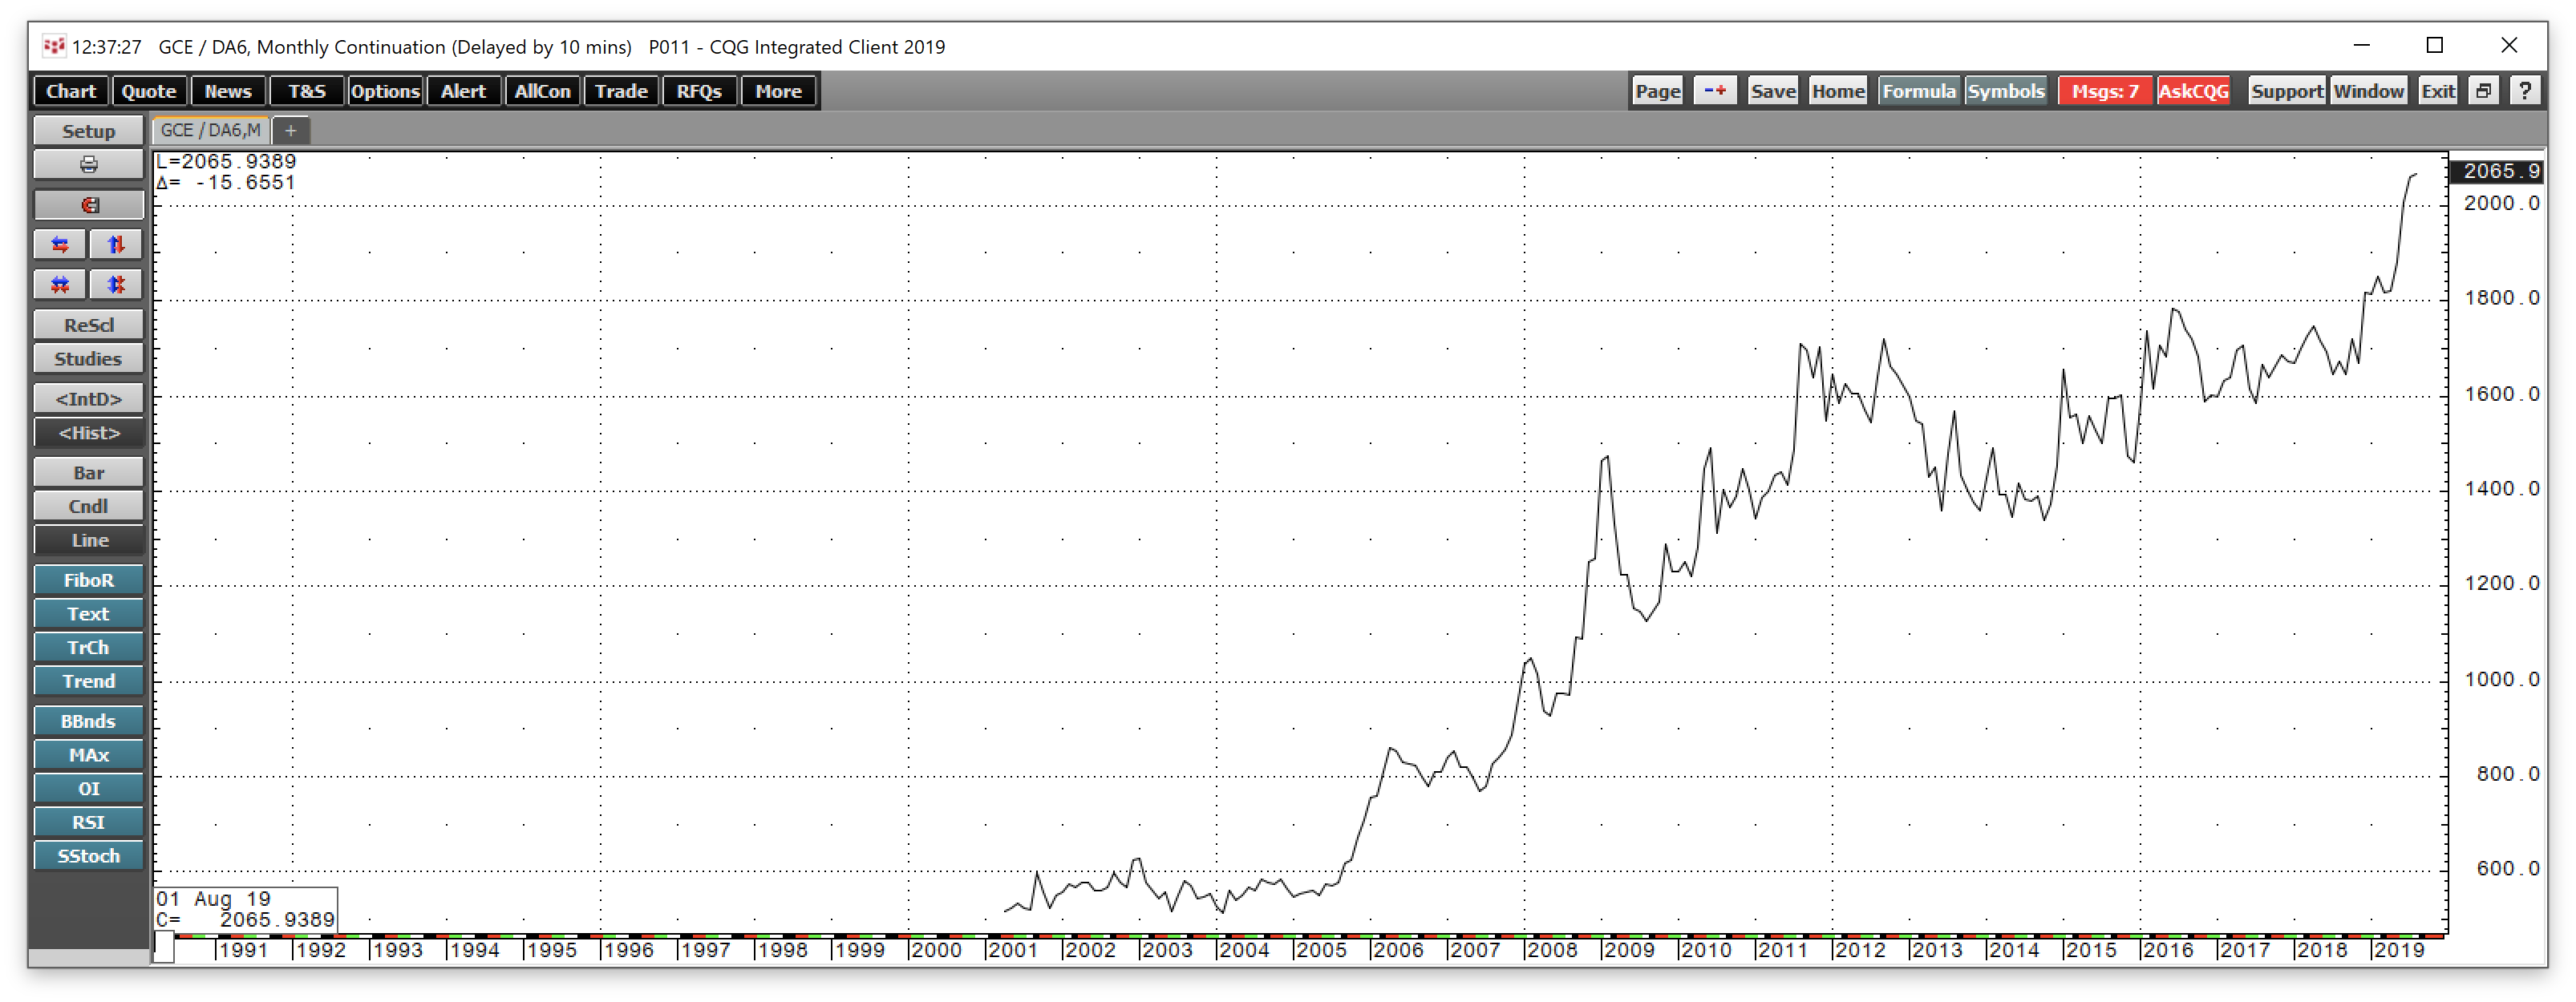
The monthly chart of gold in Australian dollar terms shows that at A$2065.90 it is at a record level. Gold is also trading at its highest price in modern history against the Canadian dollar, the Chinese yuan, the Russian, ruble, and many other world currencies.
The bottom line is the bullish price pattern in all currencies validated the bull market in the gold market.
Gold could reach $2000 per ounce a lot sooner than most market participants believe
Since the price of gold is already at a record high in a host of currencies around the world, there is no reason why it cannot do the same in US dollar terms. Since the dollar is the world's reserve currency, a rise to $2000 per ounce or higher will be a significant statement for not just gold, but the state of fiat currencies.
Central banks around the globe have said that one of the reasons why they are following an accommodative path with monetary policy is that inflationary pressures remain below the 2% target rate. However, gold is signaling that the purchasing power of currencies is declining, which is a textbook definition of inflation. It may not be long before other prices begin to rise if gold turns out to be a harbinger of inflation. By that time, it could be too late for the world's monetary authorities who could scramble to increase interest rates as inflation suddenly appears.
There are two components to interest rates; real rates and inflation. Negative real rates are stoking the bullish price path of gold and could eventually do the same for other commodities and consumer products. Record high levels of debt, falling interest rates, and low unemployment are a potent inflationary cocktail as central banks pump up stimulus.
The technical break to the upside in the gold market in dollar terms could lead to much higher prices. I would not be surprised to see the price reach the $2000 per ounce level sooner rather than later. If that occurs, it could cause lots of volatility in markets across all asset classes as central banks reassess approaches to monetary policy.
Gold mining stocks will magnify the move - the GDXJ ETF has explosive potential
The shares of gold mining companies tend to outperform the price action in the gold market on the upside and underperform on the downside. Junior gold mining shares are often more volatile than the leading established producing companies. The top holdings of the VanEck Vectors Junior Gold Miners ETF product include:
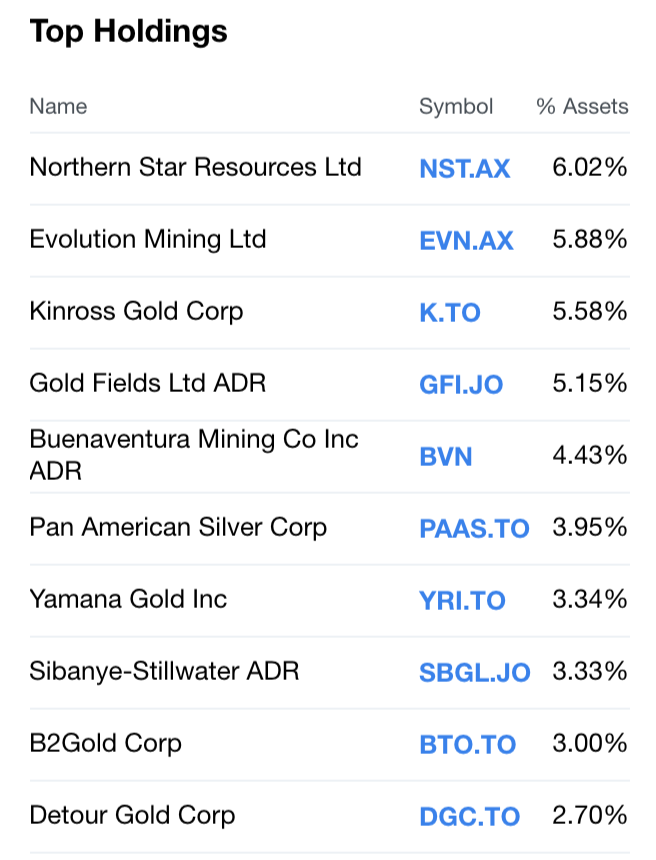
Source: Yahoo Finance
GDXJ has net assets of $4.14 billion and trades an average of over 16.4 million shares each day, making it a highly liquid market product. The ETF charges an expense ratio of 0.54%. The price of gold on the nearby August futures contract moved from $1290.80 on May 30 to the most recent high at $1467 on July 19, a rise of 13.65%.
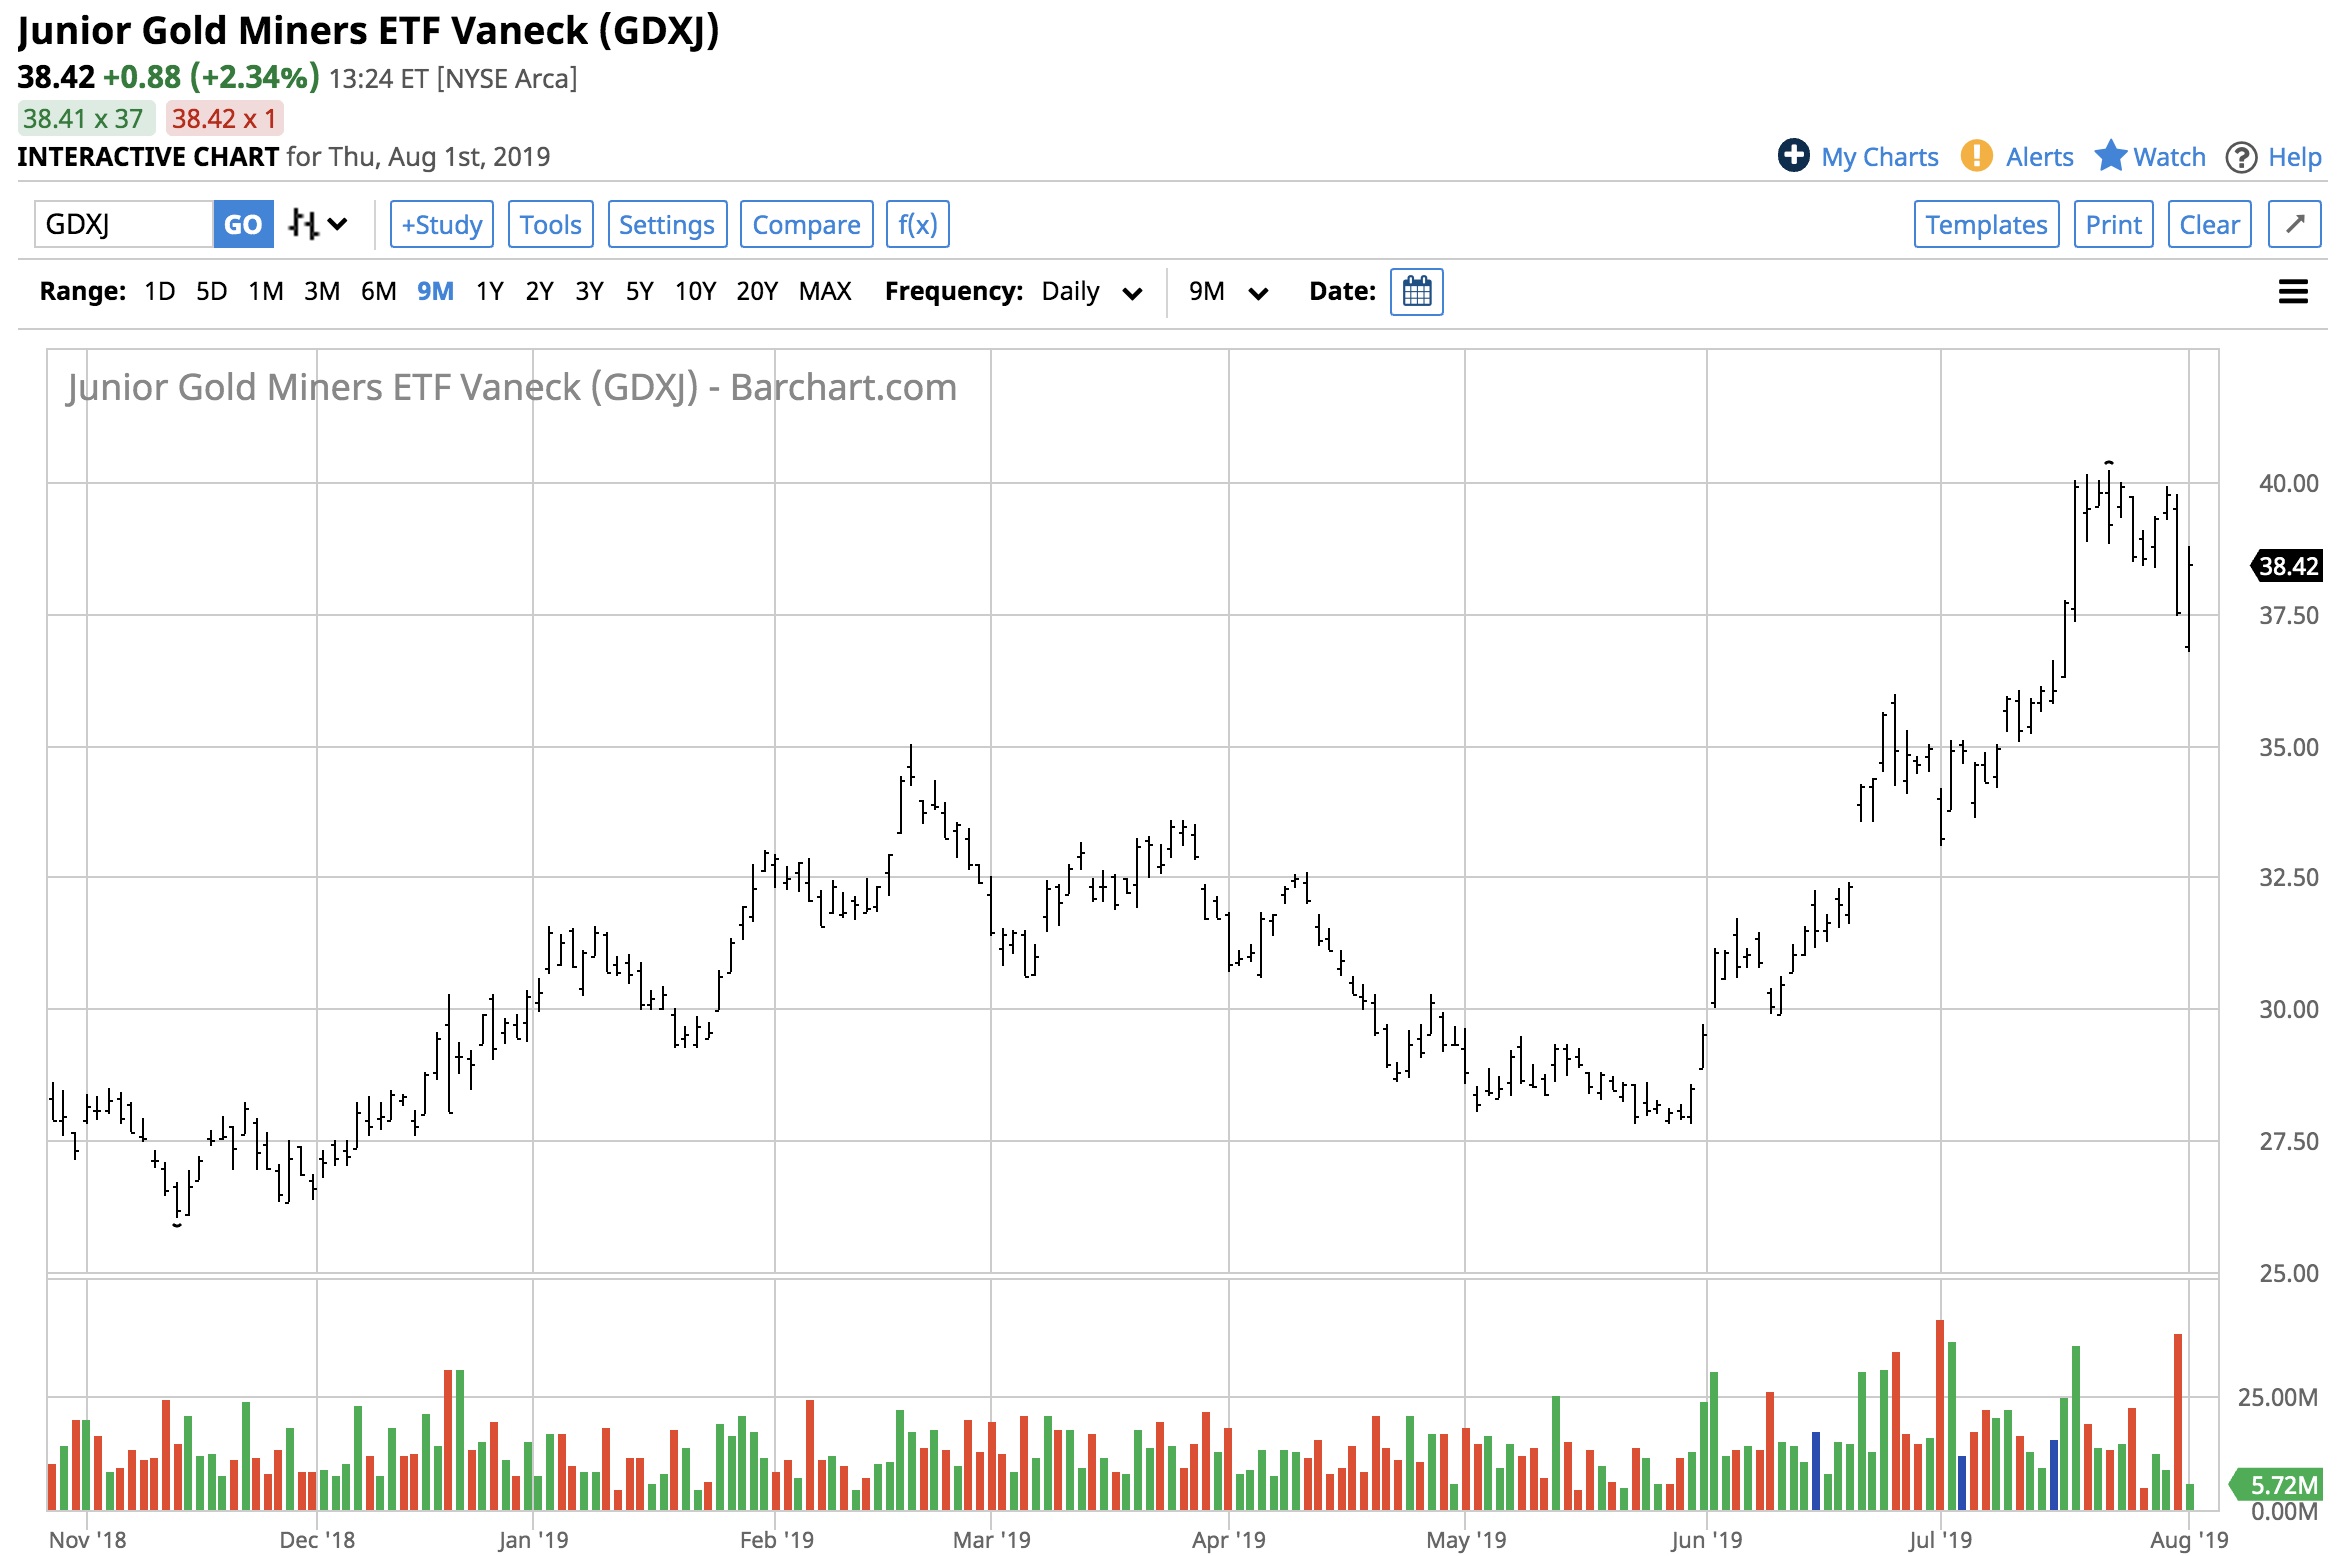
Source: Barchart
Over the same period, GDXY rose from $27.82 to $40.22 per share or 44.57%. With an over three times percentage performance, GDXY acts as a leveraged tool in the gold market during bull market periods.
If gold is going to continue to appreciate and a new all-time high in US dollar terms is in the cards for the precious metal, GDXY could provide spectacular returns over the coming months.
The Hecht Commodity Report is one of the most comprehensive commodities reports available today from the #2 ranked author in both commodities and precious metals. My weekly report covers the market movements of 20 different commodities and provides bullish, bearish and neutral calls; directional trading recommendations, and actionable ideas for traders. I just reworked the report to make it very actionable!
Disclosure: I/we have no positions in any stocks mentioned, and no plans to initiate any positions within the next 72 hours. I wrote this article myself, and it expresses my own opinions. I am not receiving compensation for it (other than from Seeking Alpha). I have no business relationship with any company whose stock is mentioned in this article.
Additional disclosure: The author always has positions in commodities markets in futures, options, ETF/ETN products, and commodity equities. These long and short positions tend to change on an intraday basis.The author is long gold
Follow Andrew Hecht and get email alerts