All That Glitters When the World Jitters is Probably Gold / Commodities / Gold & Silver 2020

The economic pressures and concerns within the global marketshave not abated just because the US Fed has ramped up the printing presses.Inversely, the stock market price levels may be elevated based on a falseexpectation of a quick recovery and of future expectations that may be veryunrealistic.
In terms of technical analysis, Gold has set up a very interesting sideways basing pattern after recently breaking above a major resistance channel near $1720. Our research team believes the recent base in Gold, near $1720 to $1740 is setting up just like the 2005 to 2007 peak in the US stock markets – just before the Credit Crisis hit in 2008. We believe the similarities of the current and past events, in price and in technical/fundamental data, are strangely similar.
An underlying asset/economic class had recently experienced a stupendous bullish rally. This euphoric rally phase was brought on because the US Fed and global markets were running high on cash and credit – heck, everyone was. The “no fear” mentality was running wild, and so was the market. Suddenly, it appeared that the credit markets were seizing up and that interest rates had nearly doubled or tripled overnight as banks and lending institutions reacted to the US Fed raising rates. At that point, the catalyst for the Credit Crisis had already been set up – much like what is happening today.
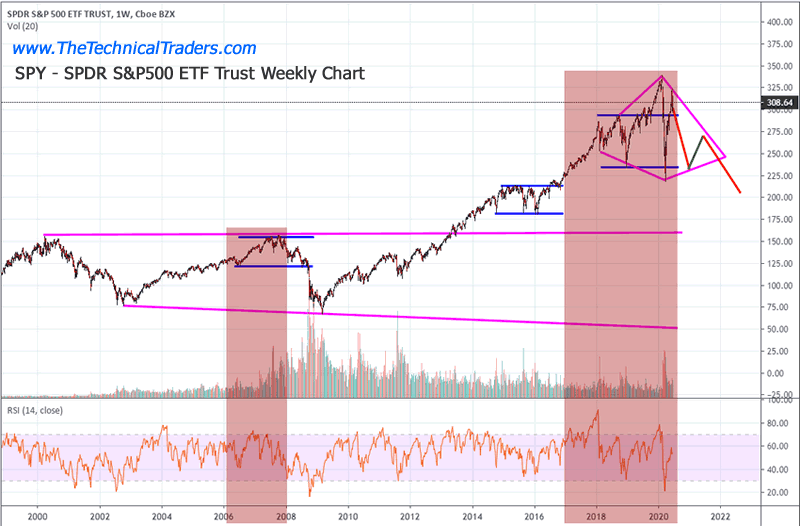
SPY – SPDRS&P500 ETF Trust Weekly Chart
This SPY chart highlights the similarities between 2006-08 and now. It may be difficult for you to see on this compressed chart, but the price pattern we’ve experienced over the past 2+ years is very similar to the price pattern that set up the peak in the markets near October 2007. This time, volatility appears to be 3x or 4x the levels from 2006/07 – yikes.
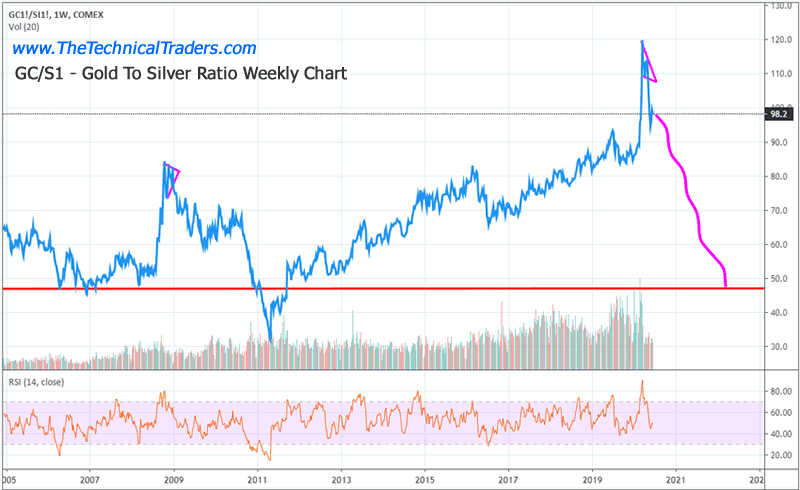
Gold to SilverPrice Ratio Weekly Chart
The current level relating the price of Gold to the price ofSilver is 98.2 – an extremely high historical level. There has never been a time like this inhistory where Gold has achieved this high of a price ratio compared toSilver. It is very likely that Gold hasrallied to these current levels as a “global hedge against risk” and thatSilver has simply been overlooked as a secondary asset. Even though supply for Gold and Silver hasbeen decreased over the past 6+ months because of demand and the COVID-19virus, we believe the current pricing relationships present a very clearopportunity for skilled technical traders.
Traditionally, the Gold to Silver ratio will likely fall tolevels below 65 to normalize the price disparity. This suggests that Silver may see a 2x or 3xrally over the next 12+ months and Gold would likely see a 60% to 150% rallyfrom current levels.
Gold Futures WeeklyChart
This Gold Futures Weekly Chart highlights Fibonacci Expansion ratios from similar pre-expansion price ranges. The first measures the advance of Gold from 2001 to 2008 – the peak of the 2008 markets. The second measures the advance of Gold from 2015 to the recent peak (2020) – the presumed peak in the US stock markets
The overlapping Fibonacci expansion levels on this chart paints a very clear picture that Gold may attempt to target certain levels should it begin a much broader upside price move…
_ $1950 – Key initial target level and could become minorresistance.
_ $2250 – The next major target level representing a 2xexpansion from the initial 2008 price rally.
_ $2731 – This key level is like to become the bigger target for 2020. Our research team believes the alignment of this level with the current price expansion in Gold sits perfectly as the next upside price target.
_ $3200 – This upper price target shows some importance – yetit is still quite far away from current price levels. Still, it is a valid upside price target.

We suggest taking a moment to review some of our earlierresearch posts related to Precious Metals and Gold…
June 3, 2020: Gold & Silver “Washout” – Get Ready For A Big Move Higher
May 28, 2020: Shortage Of Physical Gold & Silver
May 19, 2020: Gold. Silver, Miners Teeter On The Brink Of A Breakout
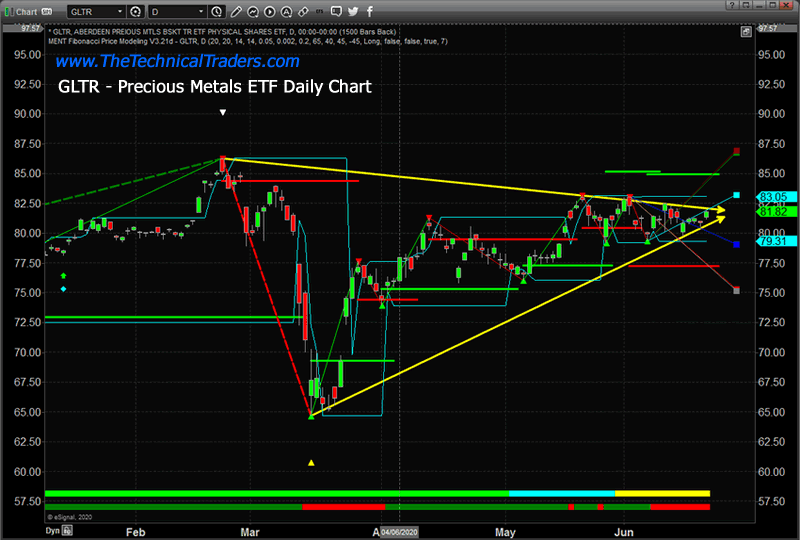
GLTR PreciousMetals ETF Daily Chart
This Daily GLTR chart highlights the current FLAG formationthat has setup in price and is about to breakout/breakdown. Our researchers believe the obvious breakoutmove to the upside is going to happen given the current global economicenvironment and the fact that we are looking at Q2 data within 10+ days thatwill likely shock many investors. Noticethat our Fibonacci price modeling system has drawn UPPER GREEN and LOWER REDtriggers levels well above and below the current FLAG APEX level. This adaptive p[rice modeling system attemptsto track price rotation and ranges while adapting internal factoring levels toidentify proper Trigger and Target levels. At this point, GLTR must move above $85 to trigger a new BULLISH TRENDor below $77.50 to trigger a new BEARISH TREND.
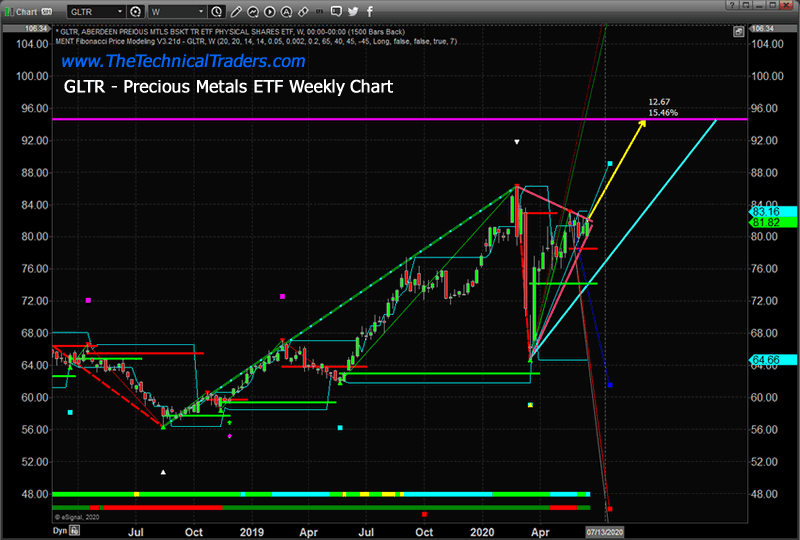
GLTR PreciousMetals ETF Weekly Chart
This Weekly GLTR chart highlights a 100% Fibonacci expansionrange from the previous upside price rally levels. Should GLTR breakout to the upside andcomplete a 100% measured upside price move, the next target level for GLTRwould be $94.70 – nearly 15.5% higher.
This is an incredible opportunity for skilled technicaltraders if they understand how the precious metals and miners sectors arealigning for a bigger move higher. Therehas rarely been a time in history where Gold and Silver have been thisdepressed in terms of pricing when the global economy and stock markets havebeen this inflated/elevated. It really may be the “opportunity of a lifetime”.
We believe the next 15 to 30+ days will prompt a “melt-up” inGold to levels near $2000 to $2100. Silver will likely rally to levels above$25 to $26 over that same span of time. Once the bigger price breakout begins in Silver, attempting to normalizeto the advanced price levels in Gold, Silver will begin to rally much quickerthan Gold prices. We believe that willhappen as Gold nears and breaches the $2000 price level.
For skilled technical traders, this extended price move in Precious Metals, Miners, and a host of other sectors presents a very clear opportunity to time and execute some very exciting trades. We had been warning our friends and followers for over 18+ months now that the end of 2019 and all of 2020 was going to be incredible years for skilled traders. Don’t miss the bigger moves – they are about to unfold over the next 30 to 60+ days and continue well into 2022.
In short, I hope you glean something useful from this article and that I don’t come across as a doomsday kind of guy. If this is the start of a double-dip, it’s going to be huge, if it’s the start of a bear market, it’s going to be life-changing. If you are new to trading, technical analysis or are long-term passive investor worried about what to do you can follow my lead and trades both as a swing trader and my long term investing signals using simple ETFs at www.TheTechnicalTraders.com
Chris Vermeulen
www.TheTechnicalTraders.com
Chris Vermeulen has been involvedin the markets since 1997 and is the founder of Technical Traders Ltd. He is an internationally recognized technical analyst, trader,and is the author of the book: 7 Steps to Win With Logic
Through years ofresearch, trading and helping individual traders around the world. He learnedthat many traders have great trading ideas, but they lack one thing, theystruggle to execute trades in a systematic way for consistent results. Chrishelps educate traders with a three-hourvideo course that can change your trading results for the better.
His mission is to help hisclients boost their trading performance while reducing market exposure andportfolio volatility.
He is a regularspeaker on HoweStreet.com, and the FinancialSurvivorNetwork radio shows. Chriswas also featured on the cover of AmalgaTrader Magazine, and contributesarticles to several leading financial hubs like MarketOracle.co.uk
Disclaimer: Nothing in this report should be construed as a solicitation to buy or sell any securities mentioned. Technical Traders Ltd., its owners and the author of this report are not registered broker-dealers or financial advisors. Before investing in any securities, you should consult with your financial advisor and a registered broker-dealer. Never make an investment based solely on what you read in an online or printed report, including this report, especially if the investment involves a small, thinly-traded company that isn’t well known. Technical Traders Ltd. and the author of this report has been paid by Cardiff Energy Corp. In addition, the author owns shares of Cardiff Energy Corp. and would also benefit from volume and price appreciation of its stock. The information provided here within should not be construed as a financial analysis but rather as an advertisement. The author’s views and opinions regarding the companies featured in reports are his own views and are based on information that he has researched independently and has received, which the author assumes to be reliable. Technical Traders Ltd. and the author of this report do not guarantee the accuracy, completeness, or usefulness of any content of this report, nor its fitness for any particular purpose. Lastly, the author does not guarantee that any of the companies mentioned in the reports will perform as expected, and any comparisons made to other companies may not be valid or come into effect.
Chris Vermeulen Archive |
© 2005-2019 http://www.MarketOracle.co.uk - The Market Oracle is a FREE Daily Financial Markets Analysis & Forecasting online publication.