Bitcoin Gold market update: Bullish on inverted head-and-shoulders pattern
BTG/USD technical are strongly positive in the short-term. It is only a matter of time before the price steps above $18.00 and correct to $20.00.
BTG/USD is among the biggest single digit gainers on Wednesday. Intraday charts show a formidable 4% increase in value on the day. Moreover, Bitcoin Gold is trading above both the 50 Simple Moving Average (SMA) and the 100 SMA 2-hour.
The reaction to the completed inverted head-and-shoulders pattern increased the bull’s confidence in the breakout on Tuesday. The price stepped above $17.00 on May 1. The building bullish momentum from the short-term support at $17.00 has formed an engulfing candlestick that has spiked above $17.50 and tested $18.00.
Technicals are strongly positive at press time with the Relative Strength Index (RSI) having entered the overbought zone. It is only a matter of time before the price steps above $18.00. Similarly, the moving average convergence divergence (MACD) is sharply exploring the levels in the positive territory, which means that the trend is largely in the favor of the bulls.
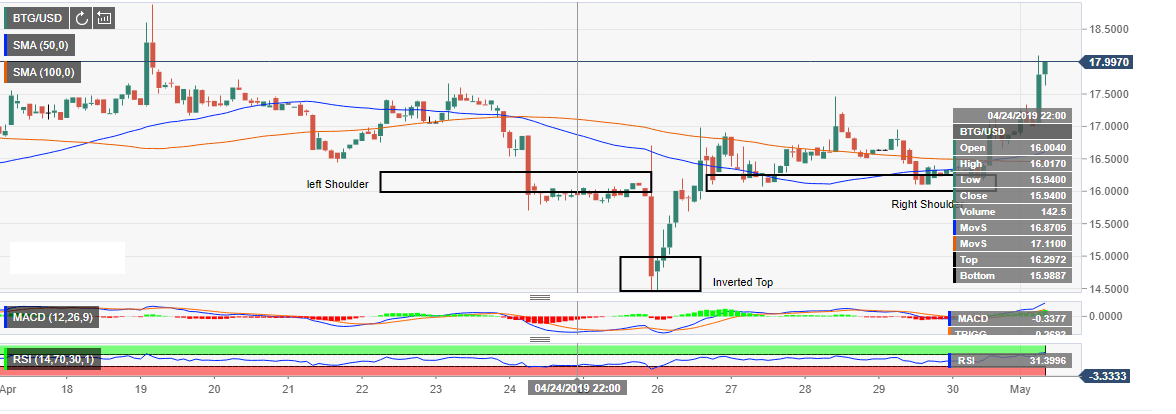
Bitcoin Gold Key technical levels
RSI 2-hour: 73.33
MACD 2-hour: +0.2939
50 SMA 1-hour: $16.62
100 SMA 1-hour: $16.48
BEST BROKERS TO TRADE CRYPTO
Information on these pages contains forward-looking statements that involve risks and uncertainties. Markets and instruments profiled on this page are for informational purposes only and should not in any way come across as a recommendation to buy or sell in these assets. You should do your own thorough research before making any investment decisions. FXStreet does not in any way guarantee that this information is free from mistakes, errors, or material misstatements. It also does not guarantee that this information is of a timely nature. Investing in Open Markets involves a great deal of risk, including the loss of all or a portion of your investment, as well as emotional distress. All risks, losses and costs associated with investing, including total loss of principal, are your responsibility.