Buying The Dip In Gold With CEF
Gold reached highs in early September and took a break.
A retreat on calm in trade, but Iran and the Middle East are supportive.
Lots of room before technical support after the recent move.
Bull markets suffer setbacks - interest rates are favorable.
CEF holds London Good Delivery physical gold and silver bars.
The gold market has calmed since reaching its most recent high at the beginning of September. December gold sitting at around the $1500 per ounce level on September 17.
The ECB cut its deposit rate by ten basis points to negative 50 basis points at its September meeting. They also restarted the program of quantitative easing to the tune of 20 billion euros each month beginning in November. The final meeting for ECB President Mario Draghi was a continuation of dovish monetary policy in Europe.
Last week, the US Federal Reserve trimmed the Fed funds rate by 25 basis points for the second time since late July. The Fed ended its balance sheet normalization program at the July 31 meeting. Interest rates are trending lower around the world, which is fundamentally supportive of the price of gold. Central banks around the world hold the yellow metal as a reserve asset. As rates move to the downside, gold becomes more attractive as an asset because of its history as a store of value. For those looking to buy the current correction in the gold market, the Sprott Physical Gold and Silver Trust (CEF) could provide an option.
Gold reached highs in early September and took a break
In the aftermath of the June Fed meeting, the price of gold began its most significant rally in years. News that the US central bank would start to lower interest rates lit a bullish fuse under the yellow metal.
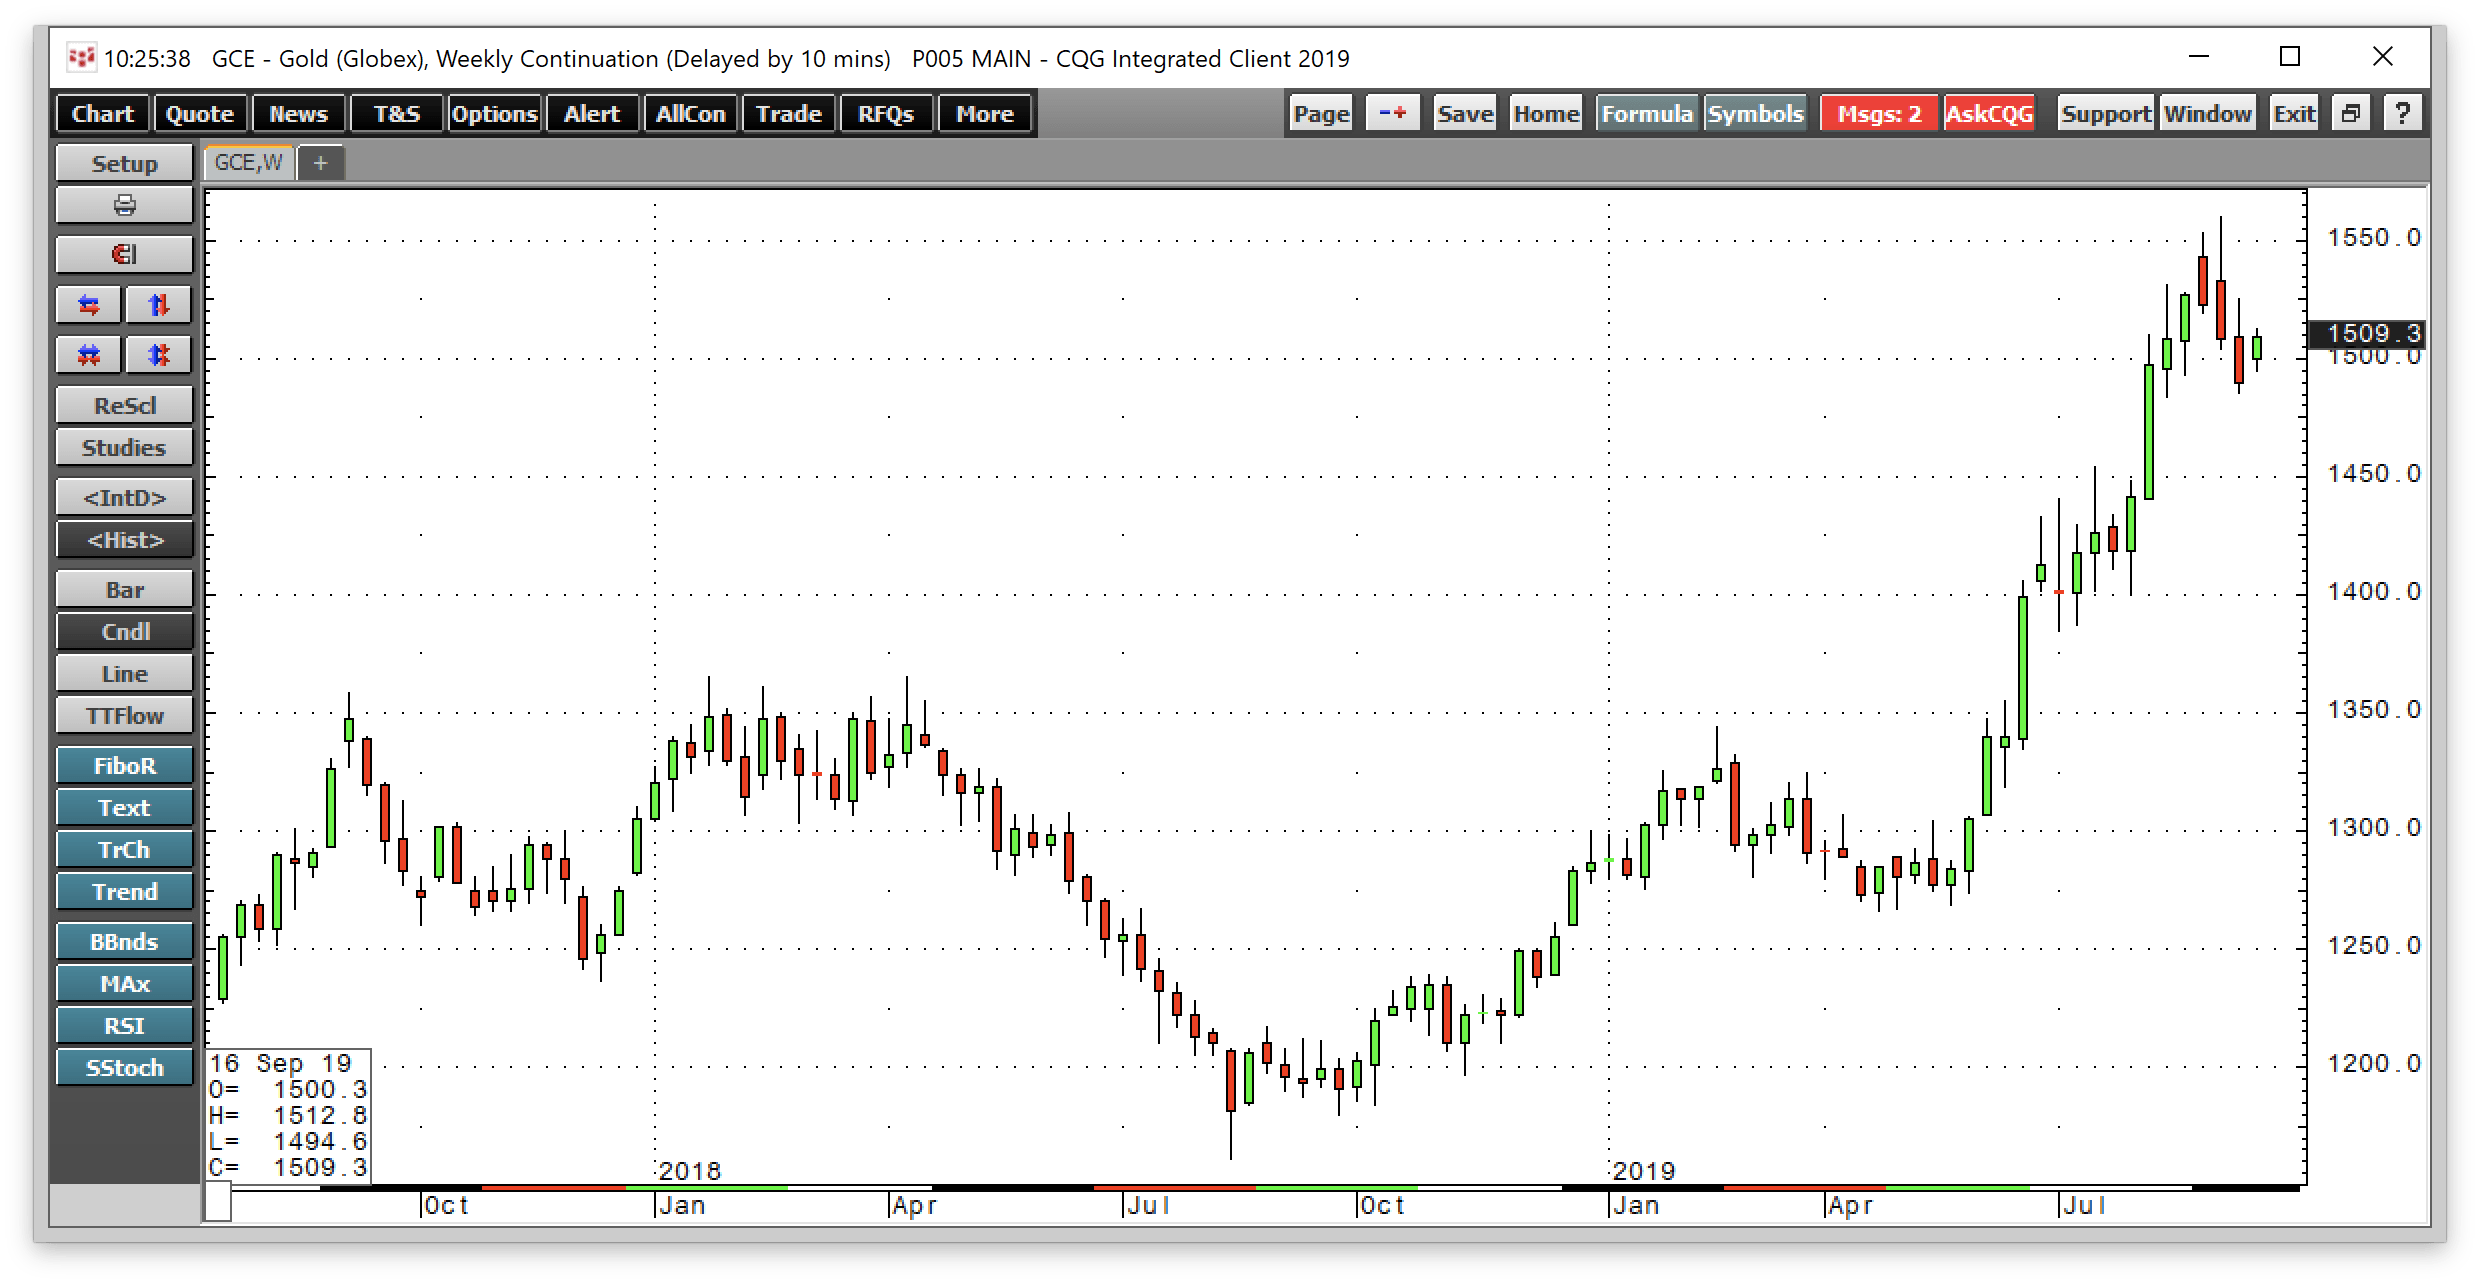
Source: CQG
The weekly chart shows that gold rose from a low at $1266 per ounce during the week of April 22. Two months later, the price rose above its level of critical technical resistance as it broke out on the upside. The precious metals' price moved above the top end of a $331.30 trading range that had been in place since 2014.
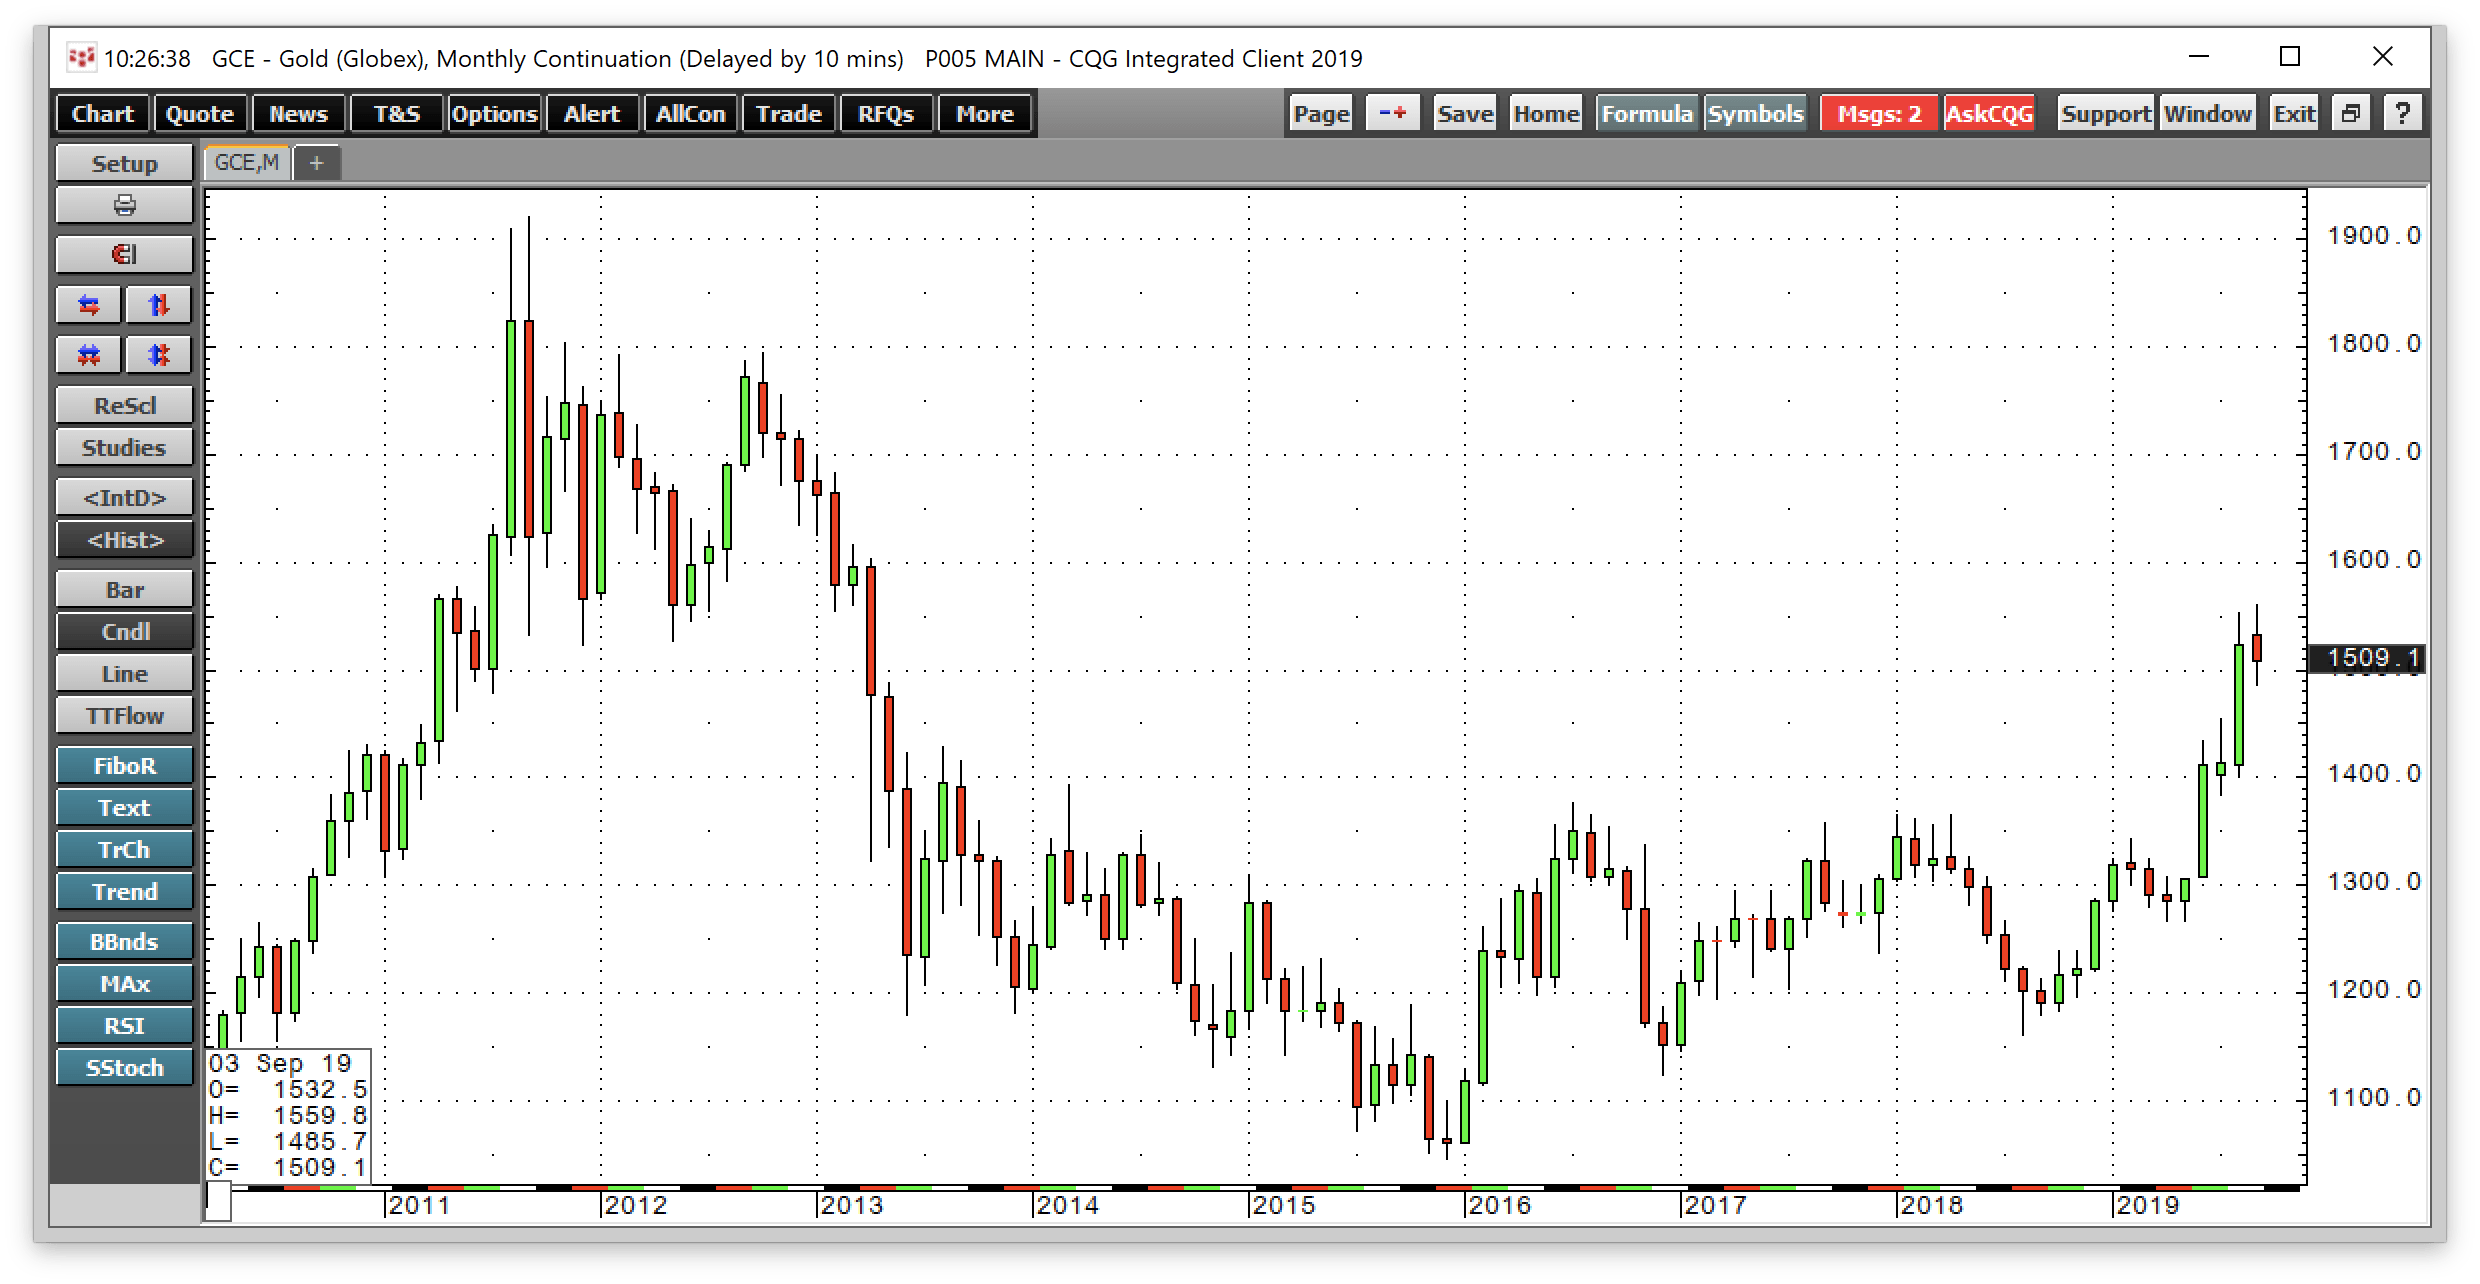
Source: CQG
The monthly chart illustrates that Fed guidance that rates would fall by the end of 2019 was enough to send the price to the highest price since 2013 in June. On July 31, the US central bank lowered the Fed Funds rate by 25 basis points and ended its program of quantitative tightening. On August 1, US President Trump escalated the trade war with the Chinese by slapping new tariffs on China's exports to the US. The combination of lower rates and uncertainty over trade sent the price of nearby gold futures to a high at $1559.80 during the first week of September.
A retreat on calm in trade, but Iran and the Middle East are supportive
The shift between optimism and pessimism over the trade war between the US and China took a turn to a more positive outlook over the recent weeks. China extended an olive branch on trade to the US in the form of some soybean purchases and a reduction in tariffs on some items. The two sides are now talking and negotiating again. The calm in trade removed some of the fears of a global recession, and the price of gold declined.
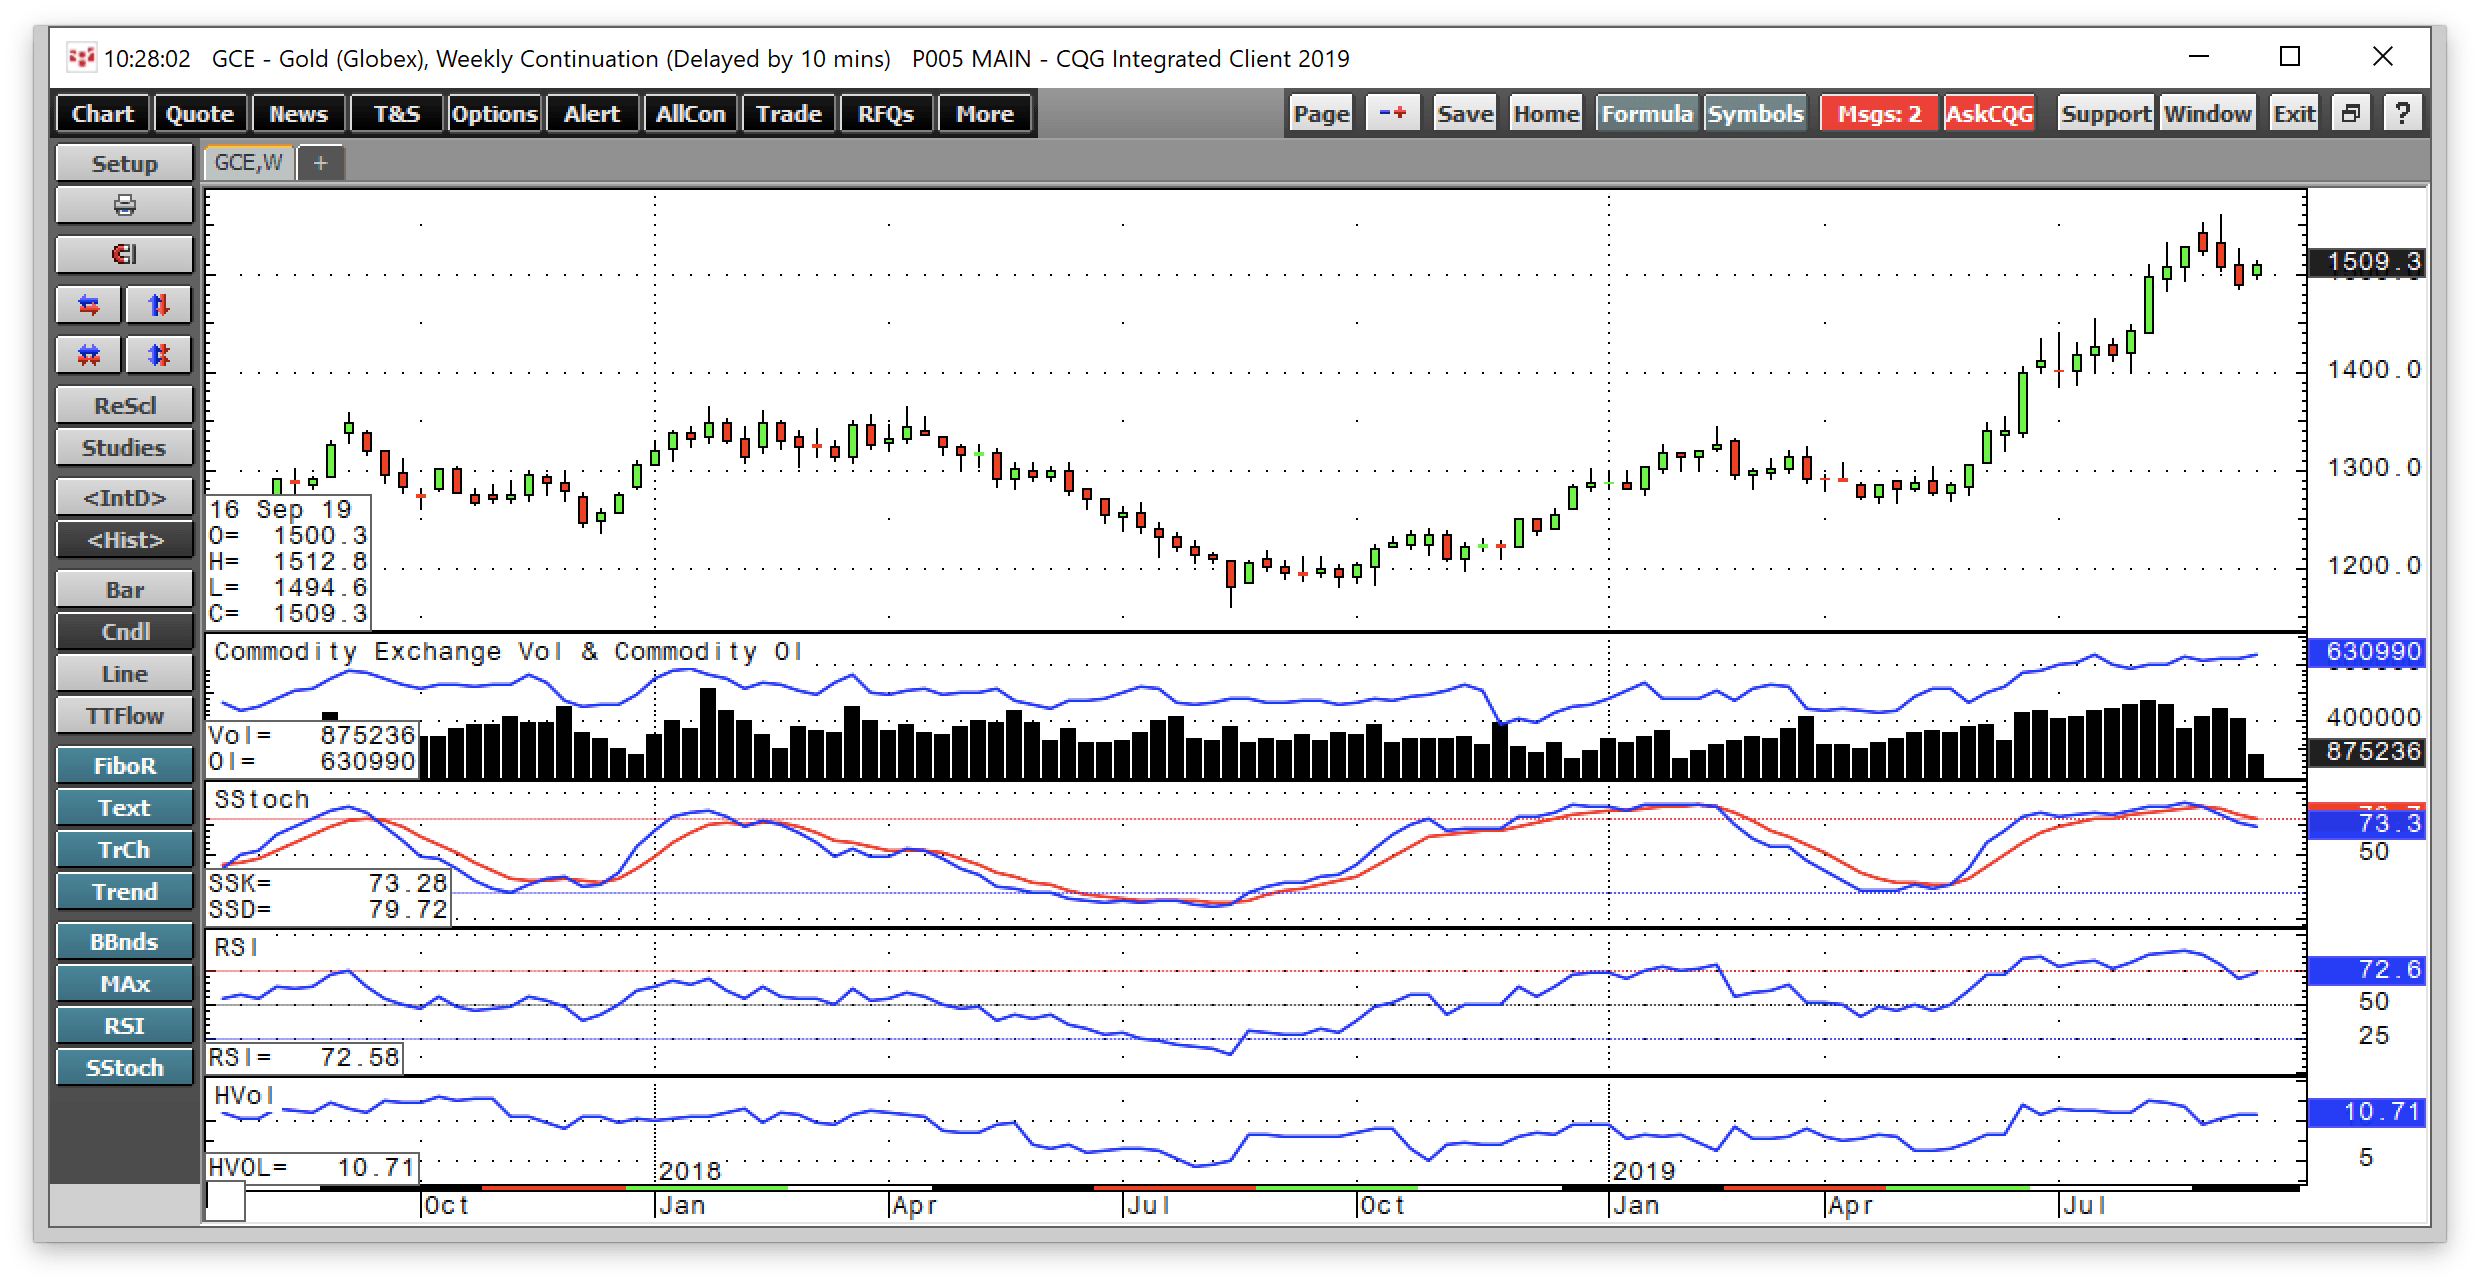
Source: CQG
The weekly chart shows that gold was ready for a correction after a run that took the price from $1266 in late April to $1559.80 in early September, a rally of 23.2%. Relative strength and price momentum indicators had risen into overbought territory.
Meanwhile, rising open interest to the 630,000-contract level provides a mixed blessing for gold. Growing open interest and increasing price is a validation of a bullish trend in a futures market. On the other hand, the increase in the total number of open long and short positions is a sign that speculative longs may have become a bit too enthusiastic about the rally in the precious metal. The price of gold corrected to a low at $1485.70 last week. However, the attacks on Aramco's oilfields in Saudi Arabia lifted the price back over the $1500 level. The assault that took out half of the Saudi's daily production amounting to 5% of the world's requirements injected uncertainty back into the market even though the trade war calmed.
Lots of room before technical support after the recent move
From July 2016 through June 2019, for three years, technical resistance in the COMEX gold futures market stood at $1377.50 per ounce. The price rose to the level in July 2016 in the aftermath of the shock from the Brexit referendum in late June of that year. Gold had reached a bottom in December 2016 at $1046.20 per ounce, and the move to the July high capped the market and created a formidable level of technical resistance that stood until June 2019.
When gold rose above the July 2016 peak, the technical resistance level became support. With gold at around the $1508 level on September 17, gold has lots of downside room for a correction before the bullish trend is in jeopardy. Gold could drop $130.50 per ounce from $1508 before reaching the price that would threaten the current bullish trend and the next leg higher in a bull market that began back in the early 2000s.
Bull markets suffer setbacks - interest rates are favorable
Few markets move in a straight line. Commodity prices can be highly volatile, and it is not unusual for the price of a raw material to double, triple, or halve in value over a short period. However, those moves tend to come from shocks to the system in the form of a weather event, crop disease, policy change, war, or natural disaster. When the supply and demand equation changes suddenly, commodity prices tend to move like few other assets.
Gold is both a commodity and a financial asset. Central banks around the world hold gold as part of their foreign exchange reserves. Therefore, while the gold market can become volatile at times like other members of the commodities asset class, its volatility tends to be lower than in other raw materials, but higher than in the world's leading currencies.
Even the most aggressive of bull markets suffer setbacks, which are often healthy for the market. When a bullish trend pauses and pulls back, it tends to cleanse the weaker longs making room for new buyers to enter positions on price dips. The pattern of falling interest rates around the world makes gold shine even more brightly. Gold competes with other risk assets, and lower yields on fixed-income instruments increase the attractiveness of the yellow metal as an investment vehicle. Over the past few weeks, both the ECB and US Fed cut interest rates. So long as this trend continues, buying gold on pullbacks could be the optimal strategy for investment in the yellow metal.
CEF holds London Good Delivery physical gold and silver bars
There are many options when it comes to an investment in gold from the physical metal to futures and options to a host of leveraged and unleveraged instruments that seek to replicate the price action of the yellow metal on the up and the downside. Mining stocks also offer a path for investment in the gold market. The fund summary for the Sprott Physical Gold and Silver Trust states:
Sprott Physical Gold and Silver Trust is an exchange traded commodity launched and managed by Sprott Asset Management, LP. The fund invests in commodity markets. It invests in London Good Delivery physical gold and silver bullion. The fund was formerly known as Central Fund of Canada Limited. Sprott Physical Gold and Silver Trust was formed on November 15, 1961 and is domiciled in Canada.
Source: Yahoo Finance
CEF has net assets of $2.878 billion and trades an average of 702,290 shares each day. The price of gold rallied by 23.2% from the April low to the early September high. The price of silver rallied from $14.245 during the week of May 28 to a high at $19.54 during the week of September 3, a rise of 37.2%.
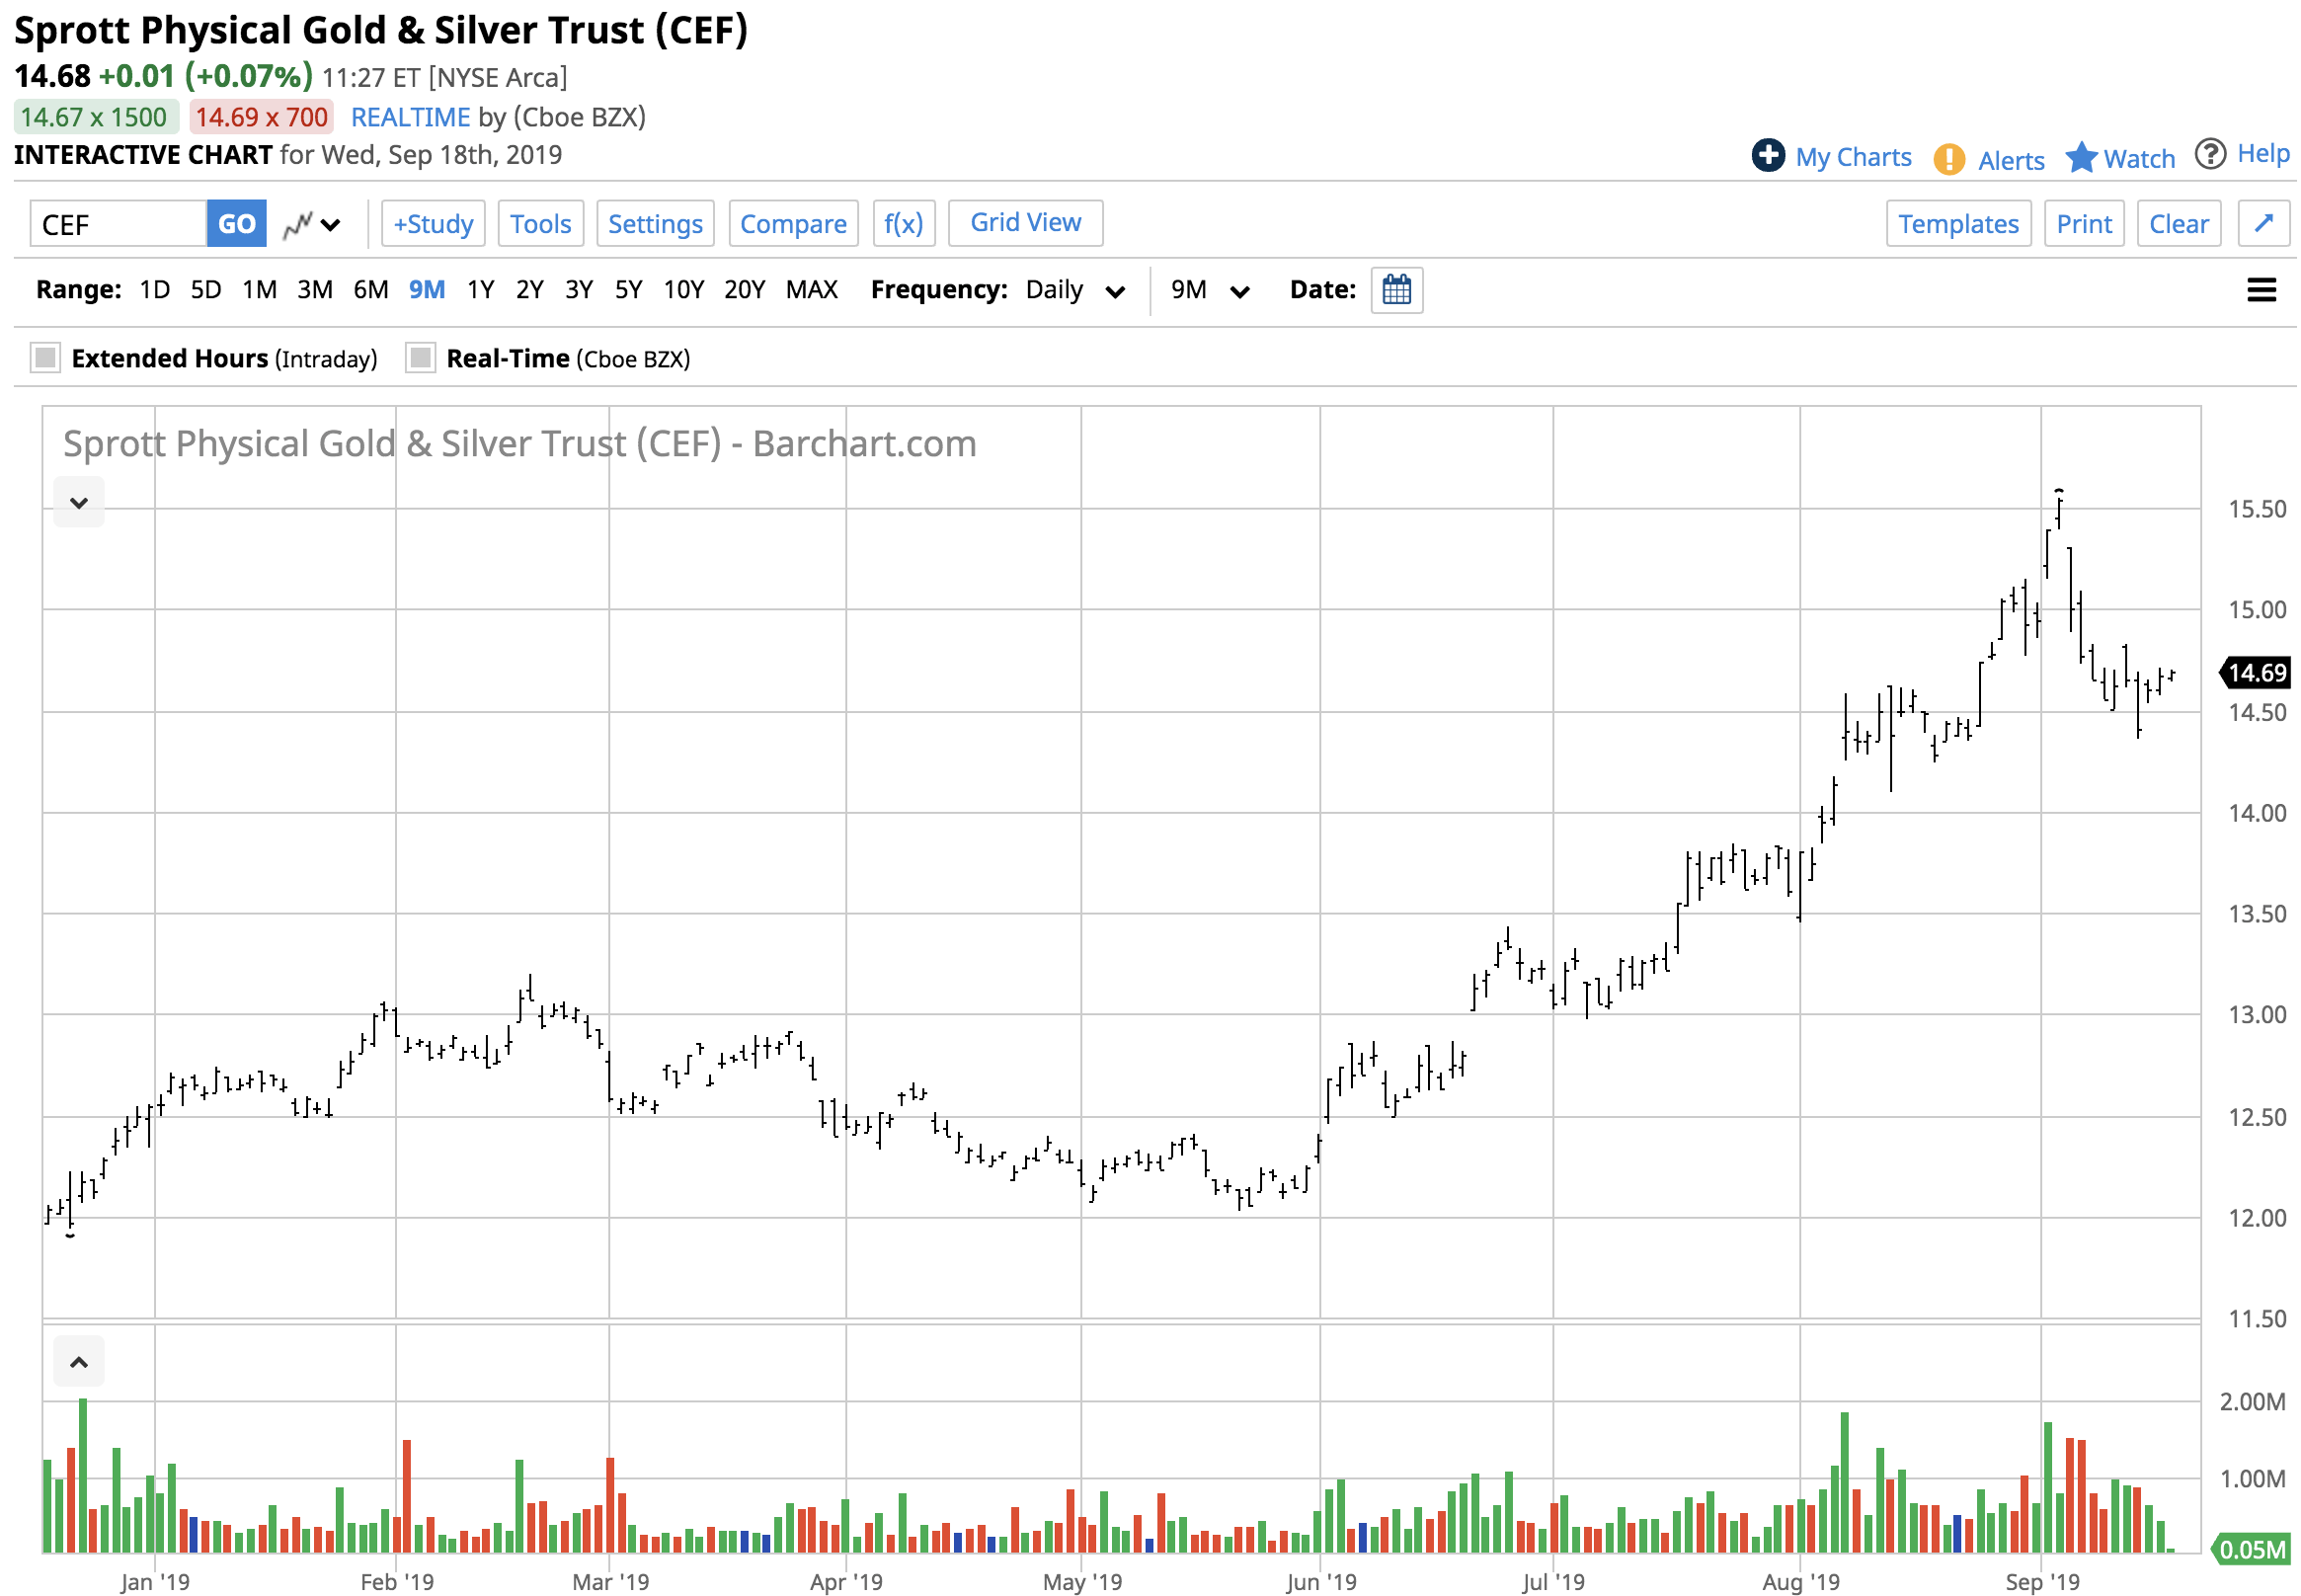
Source: Barchart
The chart shows that when silver and gold prices took off to the highs, CEF rose from $12.03 on May 21 to $15.55 per share on September 4 per share for a gain of 29.3% which was within one percent of a blended performance return for gold and silver futures over the period.
Gold and silver had a bullish summer season in 2019. Falling interest rates and a continuation of uncertainty in the world should keep the metals in bullish trends over the coming weeks and months. Buying on a scale-down basis during price corrections could be the optimal approach to the precious metals over the rest of 2019.
The Hecht Commodity Report is one of the most comprehensive commodities reports available today from the #2 ranked author in both commodities and precious metals. My weekly report covers the market movements of 20 different commodities and provides bullish, bearish and neutral calls; directional trading recommendations, and actionable ideas for traders. I just reworked the report to make it very actionable!
Disclosure: I/we have no positions in any stocks mentioned, and no plans to initiate any positions within the next 72 hours. I wrote this article myself, and it expresses my own opinions. I am not receiving compensation for it (other than from Seeking Alpha). I have no business relationship with any company whose stock is mentioned in this article.
Additional disclosure: The author always has positions in commodities markets in futures, options, ETF/ETN products, and commodity equities. These long and short positions tend to change on an intraday basis.The author is long gold and silver
Follow Andrew Hecht and get email alerts