Can Gold Miners Rally If Volatility Returns?
Gold mining stocks have been influenced by upgrades/downgrades related to some of the most important companies in the commodities sector.
But this outlook neglects the positive impact that could be seen if a more risk-averse market environment leads to bull trends for the industry.
GDX might be one of the best ways of benefiting from rising volatility levels if added market uncertainty is present in the second half of this year.
Image: Source
In 2018, the investor complacency that defined sentiment in stocks for the better part of the last decade has been up-ended. The possibility of global trade wars, uncertainty in tech, and a multi-year bull rally in the S&P 500 has left many investors wondering about whether or not all of the optimism can still continue. As a defensive measure, the VanEck Gold Miners ETF (NYSEARCA:GDX) offers a layer of protection against the growing potential for declines in these areas.
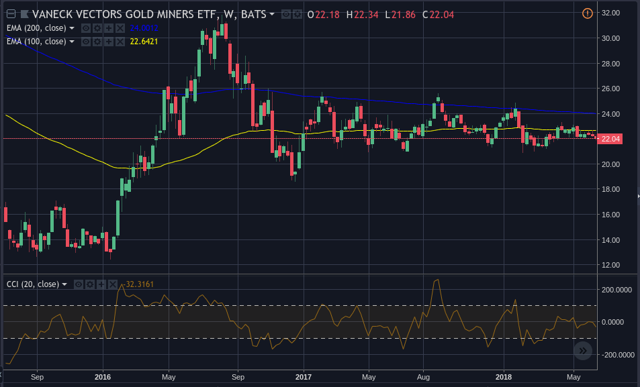
Essentially, the ETF offers diversified exposure to mining companies that stand to gain the most if gold prices move higher in the second half of this year. For these reasons, long positions can be taken in the GDX ETF at current levels - and the outlook remains bullish with prices holding support above $18.60 (which marks the lows from December 2016).
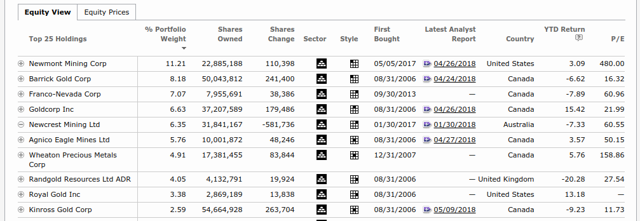
GDX Holdings Source: Morningstar
In this abbreviated graphic, we can see the top 10 stock holdings included in GDX. These stocks make up a combined total of over 60% of the fund's value (with the majority of the exposure to be found in the Canadian region). For investors, there is added attraction here given the fact that long positions in GDX should help to shield against portfolio ramifications, which may be seen if deeper trade battles between the U.S. and China unfold over the next few months.
In many ways, the star of the group has been Newmont Mining Corp. (NYSE:NEM) and recent earnings results suggest that this will likely continue to be the case. Reports from Q1 show that Newmont beat earnings estimates by $0.02, with an EPS of $0.35. Revenues gained 7.7% on an annualized basis but this performance still missed expectations by $20 million. Adjusted net income showed gains of 36%, and adjusted EBITDA showed gains of 12% (relative to Q1 2017).
This is strong underlying momentum at the fundamental level, and these are trends that could be exacerbated if risk-averse market environments turn out to be favorable for gold prices. Recent analyst upgrades from Morgan Stanley have highlighted the company's stable "production profile" and its "de-risked project pipeline" as justification for its "overweight" recommendation on the stock. At 11.2% of the GDX fund allocation, we can see that these are factors, which support the outlook for the mining ETF.
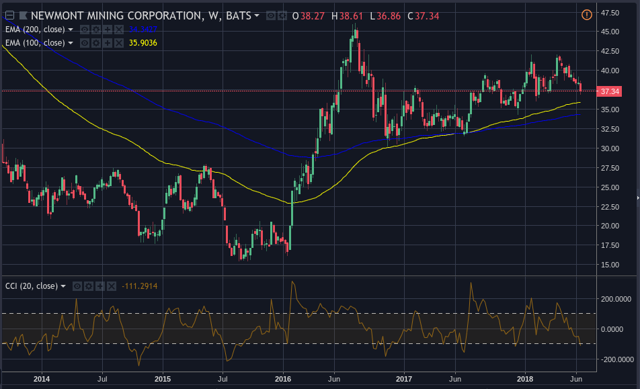
NEM Chart : Author/Tradingview
Newmont is scheduled to report earnings toward the end of July, and current expectations suggest a sharp decline to $0.33 per share. This would be a drop of more than 28% relative to the same quarter last year, and it would equate to profits of roughly $176 million (with a PE ratio of 29.6) if the forecasts are accurate. But with expectations this low, there is a stronger risk for an upside earnings surprise from Newmont - and any bullish moves that result should extend if the macro environment pushes precious metals prices higher in the second half of the year.
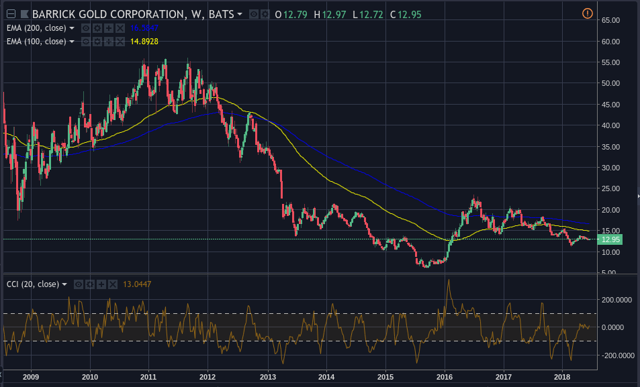
ABX Chart : Author/Tradingview
Market activity over the last year has not been as encouraging for Barrick Gold Corp. (NYSE:ABX), and recent analyst downgrades have put pressure on the stock. But the reality might not actually be this bleak. For the Q1 2018 period, Barrick Gold posted per share earnings of $0.15 (which beat analysts' estimates by a penny). Revenues were more problematic (with losses of $50 million), and the total revenue figures showed annualized declines of 10.1% (at $1.79 billion).
But the larger trends here have shown improvements in operational efficiency in ways that could benefit further from rallies in precious metals. At the stock's currently depressed levels, this creates added risk for upside reversals if the macro scenario for precious metals moves into more favorable territory.
For the company, cash flow production has been strong and the recent suspension of the Pascua-Lima project will allow Barrick Gold to focus more attention on key areas of the Chilean sections of the project. For the quarter, operating cash flow was seen at an impressive $507 million, while all-in sustaining costs matched with Barrick's prior expectations. Company guidance suggests that gold production could reach as high as 5 million ounces for the full year (at costs that are likely to hold below the $804 per ounce figures that were seen previously). Additionally, the company has made excellent progress in its ability to control its debt levels.
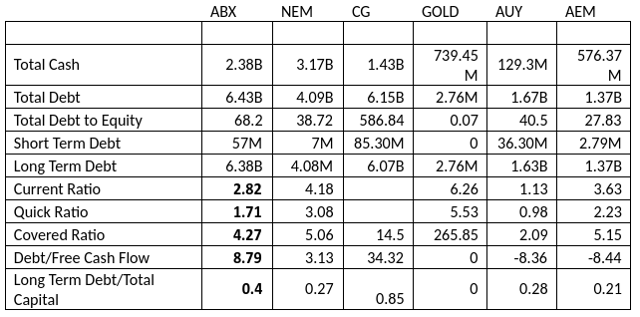
Mining Peer Comparison Chart: Author
In the chart above, we can see Barrick's debt performances relative to its industry peers. Over the last few years, Barrick has reduced its total debt levels by more than 50% (from $13.1 billion at the end of 2014 to $6.4 billion by the end of 2017). Barrick's goal is to reduce its total debt to $5 billion by the end of 2018, which is a number that is starting to look more and more realistic as the early summer trading period unfolds.
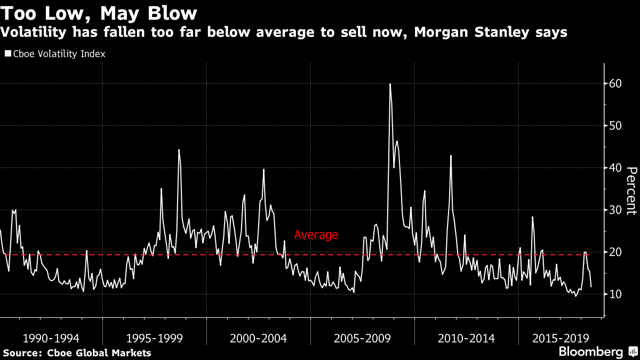
Source: Cboe Global Markets/Bloomberg
Of course, there are always broader influences at work - and sustainable rallies in GDX could be difficult to generate if gold prices trend in the bearish direction over the next few months. More than likely, markets will need to see another bout of risk aversion as a catalyst in order to validate the need for safe haven assets and higher valuations in the gold miners. One of those catalysts could be seen if there is rising volatility in equities, and it is becoming clear that stock markets are starting to trade at precarious levels.
To put things into the proper historical context, it is a good idea to look at the long-term trends in volatility that have unfolded over the last few decades (shown in the chart above). This may come as a surprise to some - but the extreme volatility that markets experienced in the early parts of 2018 was really not that 'extreme' at all. At its 2018 highs, the Cboe volatility index was actually trading near its long-term averages, and markets have only reversed in the months that followed. This suggests that investors already bearish volatility may want to consider taking gains (and that new short positions are vulnerable to upside reversals).
If we do see another simple reversion to the mean in stock volatility metrics during the second half of this year, it could benefit gold prices in ways that bring renewed bullish interest back to the major gold miners. By extension, this should limit further downside in the GDX ETF and reduced risk for long positions.
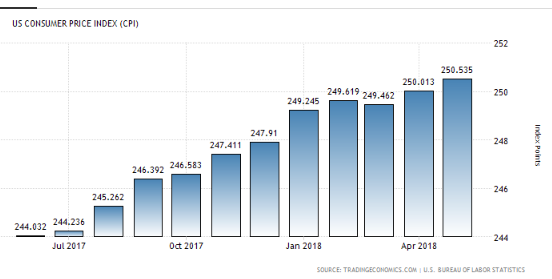
Source: Trading Economics/U.S. Bureau of Labor Statistics
In addition to the market volatility that has been in place this year, we have also seen substantive increases in inflationary pressures at both the producer and consumer levels. For consumers, this can create added financial uncertainty. For investors, these types of trends are much more clear (and, ultimately, suggest higher interest rates). This can be a bearish signal for gold as a non-yielding asset. But when we look a bit deeper, the interest rate picture might not be as clear as analysts currently anticipate.
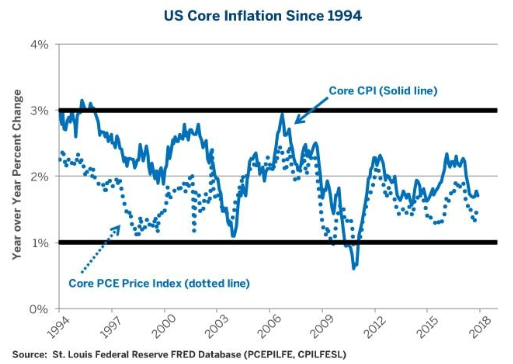
Chart: Source
Here, it is critical to look at the underlying trends seen in the personal consumption expenditures (PCE) index. In the short term, market impact of this reading often minimized because this data report typically follows the consumer price index (which is more commonly covered by the financial news media). But the dominant trends in this economic reading have been relatively clear, as CPI consistently hovers in more elevated territory.
Since the PCE reading is the Fed's preferred measure of inflation, there is a risk that the market's current interest rate expectations might be too hawkish. So, if we fail to see four interest rate increases in 2018, the overall outcome could be higher valuations in funds like GDX (which are closely connected to the value of precious metals).
GDX Chart : Author/Tradingview
As a block, the major gold miners had a strong first quarter. Strong operating profits and stable cash flows suggest that the gold miners performed well in the first quarter of 2018. It can be argued that some stocks in this industry are more attractive than others - but the outlook remains positive even for the companies that are considered by analysts to be at the lower end of the performance spectrum.
There are important questions to be asked with respect to where stock market volatility is headed in the second half of this year - and it is looking as though it will not take much to send prices higher in the GDX ETF. This is not something that can be said for stocks as a whole, and this suggests long positions can be taken in GDX at current levels. The outlook remains bullish with prices hold support at $18.60, and precious metals bulls might start to build exposure to the space with diminishing prospects for downside risk in these positions.
Disclosure: I am/we are long GDX.
I wrote this article myself, and it expresses my own opinions. I am not receiving compensation for it (other than from Seeking Alpha). I have no business relationship with any company whose stock is mentioned in this article.
Follow Options Markets and get email alerts
