Can You Afford To Ignore These Two Flawless Gold Slide Indicators? / Commodities / Gold & Silver 2019

 Wehad warned you about the miners’ bluff and we hope that you heeded it. Gold isstill testing the neck level of the head-and-shoulders pattern, but silver isalready back at its 2019 lows, while miners broke decisively below them. It mayseem that the miners have declined enough and that a rebound is imminent fromthese levels. Should you hold your breath? Are we on a doorstep of a tradablerebound, or it ain’t here just yet?
Toanswer that, let’s turn to two analytical gems that have served us so well inthe past. Not once, but many times.
We would like to pointyour attention to two factors that confirm that the next move lower is going tobe significant. Yes, we know that you already know that as we provided myriadsof details beforehand, but looking at the situation from a fresh perspectiveand seeing new signals makes it easier to be patient before the move gathersreal momentum.
Thefirst of them is the analysis of the silver stocks, and the second is theanalysis of the popularity of 2 key search phrases for the gold market. Let’sstart with the former.
SilverStocks Make Themselves Heard
Wehave extensively commented on the silver stocks on April 3 (in our premiumanalysis) and on April8 (in our free analysis), when we emphasizedthat their daily decline on huge volume was the harbinger of something verybearish to happen. Let’s quote what we wrote back then – it will also serve asa brief introduction to those, who haven’t read the early-April analysis. Wewill make only small adjustments within the quote, because almost everythingthat we wrote remains up-to-date and continues to have important impact on thefollowing weeks and months.
Goldprice usually moves in tune with the silver price, and silverstocks usuallymove in tune with silver. The sizes of the moves are not identical, but theturnarounds often take place at the same time. The price moves are similarenough to say that the big moves will take place at the same time, but they aredifferent enough for the markets to provide different signals. At times, onemarket might lead the other. There may also be other specific features and intoday’s analysis, we’ll focus on one of them.
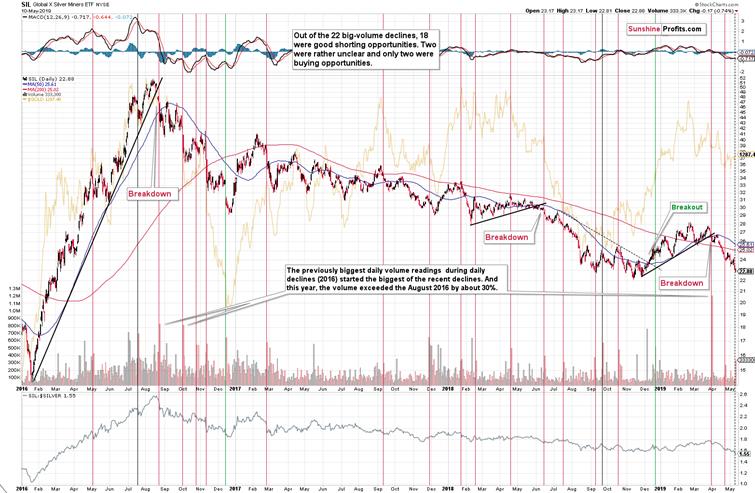
Namely,we’re going to discuss the huge daily volume spikes. And in particular, we’regoing to focus on days when the silver miners (were using the SIL ETF as aproxy for the sector) declined on big volume. There were quite a few such dayssince early 2016 and they were almost all characterized by analogous priceaction - not only in the case of silver miners, but also in the case of gold.
Toput it simply, gold usually took a dive after silver miners declined onhuge volume.
Theabove doesn’t reveal the efficiency, nor the severity of the signal, though.
Asfar as efficiency is concerned [note: we are leaving the numbers as they werein early April – we will comment on the update later in a few paragraphs],there were 19 signals and 15 of them were good (or excellent) shortingopportunities. In two cases, it was unclear if it was a good shortingopportunity or not. There were only two cases when the signal clearly failed:in December 2016 and in December 2018.
[Noneof the failed signals is similar to the current case as silver stocks areneither after a breakout, nor after several-month long decline, so let’sconsider the neutral signals]
Oneof them was mid-July 2016 case where the market moved higher one more timebefore forming the final top, and the other one was the September 2018situation, when the market moved lower in the near term, but that was actuallythe start of a bigger upleg. One case was a good shorting opportunity in themedium term, but a bad one in the near term, and the other case was theopposite. None of them clearly invalidated the signal, but to be conservative,we can say that only one additional case confirmed the signal, while the otherone didn’t. This means that [basedon information that was available in early April] we get the ultimateefficiency of 84.2% (16 out of 19). That’s an extremely highefficiency and…
That’snot everything.
Yousee, the very recent price/volume action in silver stocks was not average. Itwas special.
Thereare two reasons for it:
The daily volume was higher than what we saw previously. In fact, it was the highest daily volume that we ever saw in case of the SIL ETF.The volume spike took place right after a major breakdown.TheApril 1st volume in the silver miners was no April Fools’ Day joke. It exceededthe previous record by about 30%. Out of the recent years, we saw the biggestdaily volume during a decline in silver in 2016: in August and September. Thatwas the beginning of the biggest decline in gold of the recent years. In otherwords, the only analogy that we have based on the size of the volume points tothe biggest decline in the recent history. And the volume was even bigger thistime – it broke the previous record. Will the decline be bigger than thelate-2016 one? That’s what is very likely based on many other gold trading techniques and what the abovesilver chart is confirming.
Movingto the second point, silver miners are right after a major breakdown. Therewere two similar breakdowns in the recent past that were then followed by thehuge-volume signal. That was in August 2016 and in June 2018. In both cases,silver miners and gold continued to decline for many weeks.
Boththe above-mentioned factors suggest that 84.2% efficiency is likely understated and should in reality be higher. Inparticular, both links point to analogy between the current situation and whatwe saw in August 2016. It then took gold less than 4 months to decline over$200. And let’s keep in mind that the volume was much higher this time, so themove – based on the above chart alone – could also be bigger this time.
Basically,everything about the above signal remains up-to-date. The only thing that changed is the efficiency. It’s now even better.
Thehuge-volume decline in early April was indeed followed by visible declines inthe entire precious metals sector and this adds to the credibility of thetechnique. There was one more case in late April when we saw a relatively bigvolume during a daily decline and this was also a great shorting opportunity inthe silver stocks. It was relatively neutral in case of gold and silver, but itwas clearly a great shorting opportunity in case of the mining stocks. Overall,it seems that both cases confirmed the previous bearish implications and theefficiency of the technique.
Thereason we are mentioning all this is not only to show you that the bearishimplications that we described in early April haven’t yet fully developed asthe volume was bigger than the previous record and the decline – so far – isn’tbigger than the past slide. We are mentioning all this, because we have onceagain seen a daily decline on relatively big volume.
Consequently,the above-mentioned 84.2% efficiency is definitely understated. If it wasn’tclear what the precious metals sector is likely to do next based on what goldstocks have been doing, the silverstocks’ bearish scream should get more than one’s attention. It should resultin action. The opportunity in the mining stocks is decreasing on a dailybasis, but there’s still are still plenty profits that remain on the table,especially from the medium-term point of view.
Havingsaid that let’s take a look at the really big picture.
TheSentiment Indicator Not to Miss
Wait, that’s not a price chart.
Itisn’t. It’s a sentiment chart. However, if you’ve been monitoring the goldmarket for some time, you should immediately recognize its immense value forall precious metals investors. There are two clear spikes in the more distantpast. It’s clear that both differ from other parts of the chart and that theonly case that’s – very – similar to them is what happened several months ago.
Thechart is based on monthly values, and the first spike is based on March 2008data, while the second spike is based on August 2011 data. The seasoned goldinvestors know very well what happened on those occasions. Something verydifferent from what had happened any other time. These were the final topsbefore the blood-letting precious metals carnages started.
Thinkabout it. Two key tops in gold. Two ultimate shorting opportunities. And twoclearly visible spikes on the above chart. There were no other cases that weresimilar to them, just as there were no declines that were similarly epic. Andif anyone argues that the declines were not epic, ask them to look at thelong-term HUI Index chart. Better yet, ask them to talk to someone who wasinvested in mining stocks at that time. Have them ask these investors how muchwould they pay to be able to travel back in time for just a few seconds to screamat themselves GET OUT OF THE MINERS, GET OUT NOW! RUN!
Howmany times can you relive a given situation and make a good decision instead ofmaking the one that you would regret for years? It’s extremely rare. In fact,it’s on the border of being a miracle. And yet, that’s exactly what the abovechart does. Several months ago, we saw the third spike – it was once againcrystal clear that it happened. In the last 15 years, there were not 2 criticalsituations, but 3. The blessing here is that the implications of the thirdsignal have not yet played out. We’re running out of time, but we still haveit.
Afterthe March 2008 top, gold declined about 34%.
Afterthe August 2011 top, gold declined about 20% initially, but since there were nonew tops since, it seems that it’s more appropriate to focus on how much itdeclined before the medium-term decline ended and became the multi-yearconsolidation. From August 2011 top to the June 2013 bottom, gold declinedabout 38%.
Themost recent medium-term top in gold formed at about $1,350. And you know whereit would decline if it was to repeat the smaller of the above-mentioneddeclines and slide by 34%? To about $890 – which is exactly our final targetfor the current medium-term decline in gold based on other factors (i.a. the61.8% Fibonacci retracement based on the entire previous bull market).
Makingmoney on both: the decline (over 30% in gold alone) and the rebound (once againover 30% in gold alone) is a huge opportunity, not only because of the sizes ofthe moves, but because the target for gold is confirmed by multiple technicaltools; and because these profits might be further increased by applying moresophisticated techniques that go beyond the simple use ofleverage (which also has its merits, when applied correctly). For instance,miners and silver are likely to magnify what gold does. There’s a tremendousdifference in taking advantage of it all compared to simply waiting for gold toslide and then to come back to the current price levels, which wouldn’t resultin any return. The sleepless nights during gold’s decline would be included insuch profitless package at no extra charge, though.
It'sincredible that we received such a clear confirmation of what’s to come. Theonly more incredible thing will be when someone knows all this and then stillchooses to ignore it, losing the opportunity. You have been warned.
If you enjoyed the above analysis and would like toreceive free follow-ups, we encourage you to sign up for our gold newsletter –it’s free and if you don’t like it, you can unsubscribe with just 2 clicks. Ifyou sign up today, you’ll also get 7 days of free access to our premium dailyGold & Silver Trading Alerts. Signup now.
Thank you.
Przemyslaw Radomski, CFA
Founder, Editor-in-chief
Toolsfor Effective Gold & Silver Investments - SunshineProfits.com
Tools für EffektivesGold- und Silber-Investment - SunshineProfits.DE
* * * * *
About Sunshine Profits
SunshineProfits enables anyone to forecast market changes with a level of accuracy thatwas once only available to closed-door institutions. It provides free trialaccess to its best investment tools (including lists of best gold stocks and best silver stocks),proprietary gold & silver indicators, buy & sell signals, weekly newsletter, and more. Seeing is believing.
Disclaimer
All essays, research and information found aboverepresent analyses and opinions of Przemyslaw Radomski, CFA and SunshineProfits' associates only. As such, it may prove wrong and be a subject tochange without notice. Opinions and analyses were based on data available toauthors of respective essays at the time of writing. Although the informationprovided above is based on careful research and sources that are believed to beaccurate, Przemyslaw Radomski, CFA and his associates do not guarantee theaccuracy or thoroughness of the data or information reported. The opinionspublished above are neither an offer nor a recommendation to purchase or sell anysecurities. Mr. Radomski is not a Registered Securities Advisor. By readingPrzemyslaw Radomski's, CFA reports you fully agree that he will not be heldresponsible or liable for any decisions you make regarding any informationprovided in these reports. Investing, trading and speculation in any financialmarkets may involve high risk of loss. Przemyslaw Radomski, CFA, SunshineProfits' employees and affiliates as well as members of their families may havea short or long position in any securities, including those mentioned in any ofthe reports or essays, and may make additional purchases and/or sales of thosesecurities without notice.
Przemyslaw Radomski Archive |
© 2005-2019 http://www.MarketOracle.co.uk - The Market Oracle is a FREE Daily Financial Markets Analysis & Forecasting online publication.