CHART: 40-year cost curve shows copper price rout likely over
 Altonorte anodes port of Antofagasta, Chile. Image: Glencore
Copper was trending lower again on Friday, a day after staging a spectacular comeback from levels last seen during the global financial crisis more than a decade ago.
Copper trading in New York was pegged at $2.132 a pound ($4,700 a tonne) in afternoon trade, on track for a weekly decline of nearly 14% and the lowest close since early 2016, which marked the bottom of a brutal downcycle for commodities.
A study released Friday by commodities analyst Colin Hamilton of investment bank BMO Capital Markets makes the case that faced with an unprecedented demand shock, the mining industry needs to get serious about cutting supply:
Indeed, there are a number of examples in recent history of meaningful supply cuts marking a nadir in price cycles.
Whereas the 2015-2016 period resulted in a "long duration grind into the cost curve", today's environment is more akin to the first quarter of 2009 when prices fell rapidly, but then, as now, China was the first to recover
There has been a steady stream of announcements from major copper producers, mostly in South America, outlining production cutbacks and construction delays, over the past week.
Hamilton says uncertainty about the duration of Covid-19-related outages "is a challenge management teams and boards are dealing with, but as inventories build, ultimately definitive supply adjustment will be required".
Whereas the 2015-2016 period where copper was trading below $2.00 a pound ($4,400 a tonne) resulted in a "long duration grind into the cost curve", today's environment is more akin to the first quarter of 2009 when prices fell rapidly, but then, as now, China was the first to recover.
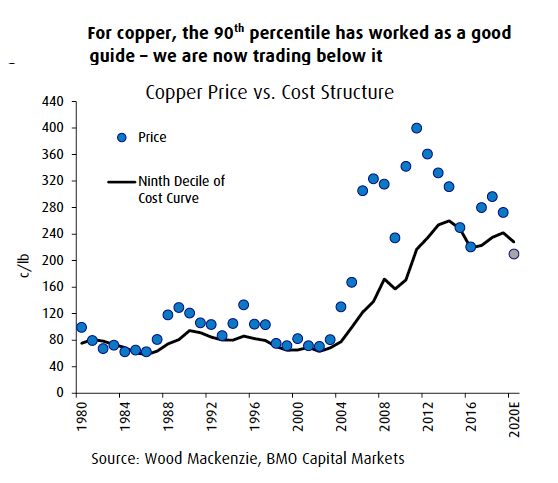
As the graph shows, copper is trading below its long term price floor based on the global production cost curve with 14% of copper operations around the world losing money at today's price.
Of all commodities, the 90th percentile of the cost curve - some $5,200 a tonne at the moment - has worked as a support level best in copper, says BMO:
In our view, the price is at a level to drive adjustment, though further falls in the near term cannot be precluded.