CHART: Commodity prices slump to 50-year low against US stocks
The Dow Jones, S&P 500 and Nasdaq closed at record highs on Friday despite signs that US jobs growth is slowing down and that expansion of the world's largest economy remains stuck around the 1% level."Following the notion of mean reversion, we should be seeing attractive investment opportunities"In contrast the S&P GSCI All Commodities index is flat so far in 2017 although prices for energy, metals and agriculture have rallied 34% from lows hit in January last year.
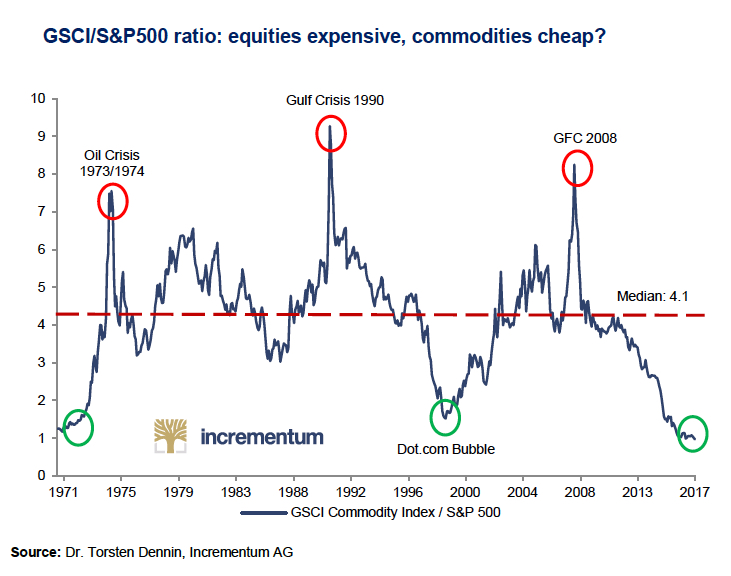
Apart from all things gold, Incrementum's 11th annual In Gold We Trust report also features broader takes on the environment for raw materials and argues that in a historical context "the relative valuation of commodities to equities seems extremely low":
In relation to the S&P500, the GSCI commodity index is currently trading at the lowest level in 50 years. Also, the ratio sits significantly below the long-term median of 4.1. Following the notion of mean reversion, we should be seeing attractive investment opportunities.

Source: Incrementum