Chart of the Week: "Worst start in history"

 Courtesy of: Visual Capitalist
THE FIRST FOUR TRADING DAYS SHOW OPTIMISM FOR 2016 IS IN SHORT SUPPLY.
The Chart of the Week is a weekly Visual Capitalist feature on Fridays.
In our review of the economic events of 2015, we noted that the simple turning of a calendar page does not rectify the problems of the previous year.
The first week of trading on major exchanges has made this even more clear.
CHINA'S ROUGH START
China kicked off the volatility this week with multiple devaluations of the yuan to reduce the strain on its foreign reserves, after burning through $120 billion in the month of December.
In reaction to this news, as well as the updated manufacturing data out of China at the beginning of the week, the Chinese stock market plunged to start 2016. The "blue chip" CSI 300 index fell 7% on Monday to trigger a market intervention mechanism that halted trading. On Thursday the problems continued when the market opened down 5% almost instantly, triggering the same mechanism to provide a 15 minute trading break. Markets re-opened, plunged again, and got halted for the rest of the day.
Here's what that whole 29 minute session looked like on Thursday, including the 15 minute break:


This morning, the yuan was strengthened and it had a semi-calming effect. The CSI 300 finished up Friday's trading in positive territory, but it is still down -9.9% for the first complete week of 2016.
THE SPILLOVER EFFECT
The whiplash from China's tumultuous market was enough to put other global markets in a tizzy. This week's Chart of the Week shows the first four days of trading on major world markets.
The S&P 500 and Dow Jones Industrial Average both opened 2016 with their worst four-day starts in history. The Nasdaq also was also down 6.4% in the first four days of trading, which took it into correction territory.
Canada's TSX continued on its 19% decline since April 2015 and European markets have been hard-hit as well. Germany's DAX was down 7.1% to start the year, and the FTSE 100 declined 4.8%.
Meanwhile, crude oil (WTI) is now $33, which is its lowest price in 14 years.
YEARLY STARTS TRENDING WORSE
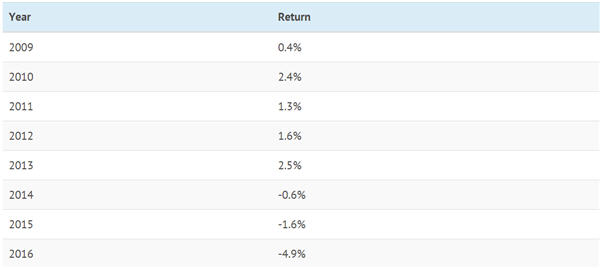
Another point we noted in the chart above is that the starts for the S&P 500 have been trending more towards negative territory each year since the Financial Crisis.
In recent times, it seems investors are starting each new year more anxious to pull the "sell" trigger. Proceed with caution in 2017.
