Chinese commodity trade barometer at record low
The once obscure Baltic Dry Shipping Index came to prominence at the start of the Chinese-led commodity supercycle around a decade ago.
The London-based Baltic Exchange tracks the cost of moving commodities along more than 50 routes around the world.
With China's emergence as the dominant trading economy in the world the index became one of the go-to barometers.
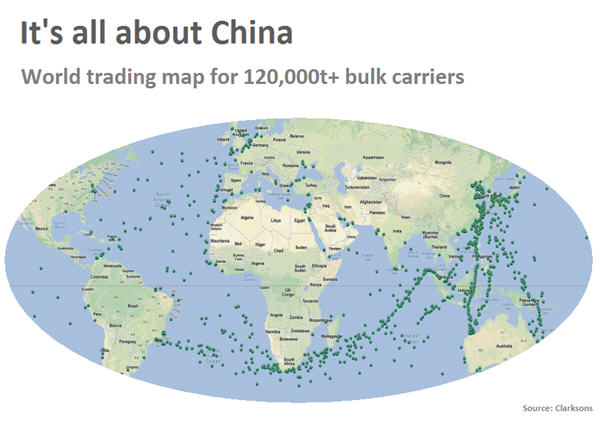
China now controls the global trade in just about every commodity including iron ore where it represents over 70% of the seaborne trade and base metals where its share is approaching 50%.
On Thursday, the overall Baltic Dry Index fell more than 3% to 519, the lowest since 1985 when Baltex started tracking the data and down by more than a third so far this year.
The index peaked at 11,677 in May 2008, but never recovered following the global financial crisis, despite the continued growth in world and Chinese bulk trade.
Of the freight rates tracked by the exchange, those for Capesize ships provide the best insight into the health of the Chinese economy.
Capesize vessels can haul roughly 160,000-180,000 tonnes and are the dominant vessels for the world's 1.2 billion tonnes seaborne iron ore trade.
Iron ore represents more than a fifth of the global dry bulk trade and is the second most traded commodity after crude oil and ahead of coal.
Iron ore shipments to China declined 12% in October, but year to date imports at 774.5 million tonnes is flat compared to a record-breaking 2014. Coal cargoes to China are imploding however with January-October data showing a 30% slump to 170 million tonnes compared to first ten months of 2014.
The surge in iron ore trade beginning a decade ago translated into a massive boost for daily earnings for Capesizes, the largest ships tracked by the index and so called because these vessels cannot use the Panama Canal.
Capesize rates topped out at an eye-watering $234,000 in June 2008. On Thursday the daily rates fell 7.2% to just $4,015 a day.

