Could This Gold Stock Have Spectacular Gains?
Technical Analyst Clive Maund explains why he thinks Tectonic Metals Inc. (TECT:TSX.V; TETOF:OTCQB) is an Immediate Strong Buy.
All the technical indications are that Tectonic Metals Inc.'s (TECT:TSX.V; TETOF:OTCQB) stock is ready to begin a major bull market that, from its current low level, could result in spectacular gains.
Before we review the latest stock charts for the company, we will first consider its fundamentals with the help of its latest investor deck and relevant news ?tems.
Note that for reasons of space, we will not go into the details of the strong management team and technical advisory committee, the supportive infrastructure for the project, and the more detailed information on the geology, which can be accessed via the link to the deck above.
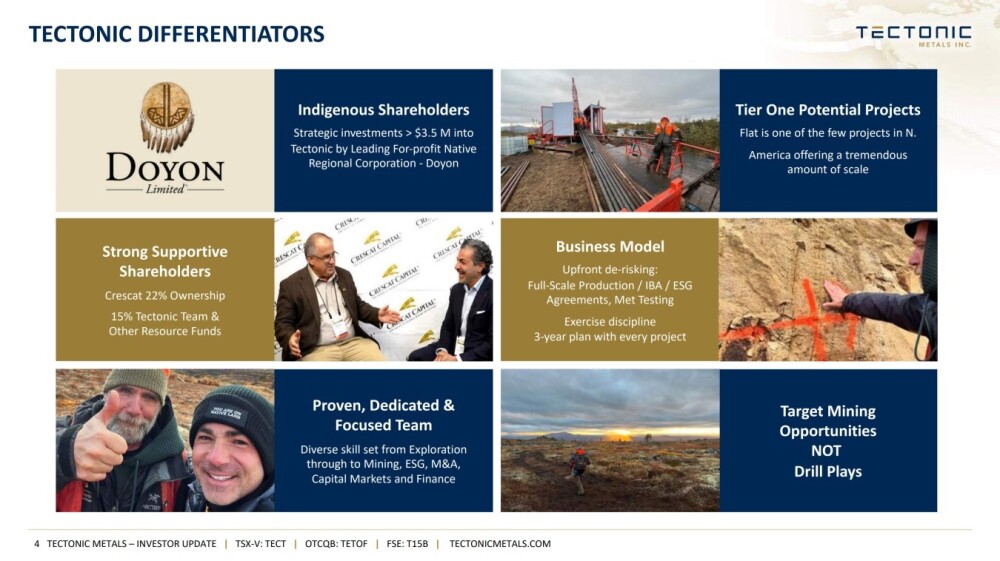
The answers to the questions "Why Tectonic, Why Now?" are given on the following slide.

Tectonic Metals has one gold project in Alaska but it is a big project with a tremendous amount of scale and in addition to having strong supportive shareholders the company has established good relations with the locals.
These points are set out on the next slide.
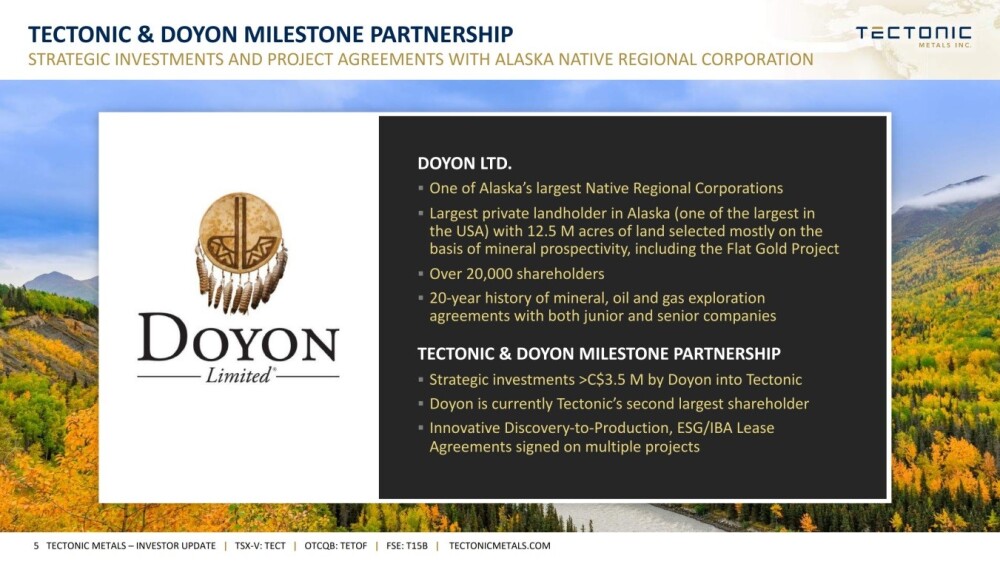
The company is distinguished by having a good working relationship with the local indigenous population to the extent that they are big shareholders in the company via Doyon Ltd. which is one of Alaska's largest native regional corporations.
Doyon holds almost 10% of the company's stock. The next slide provides some information about Doyon.
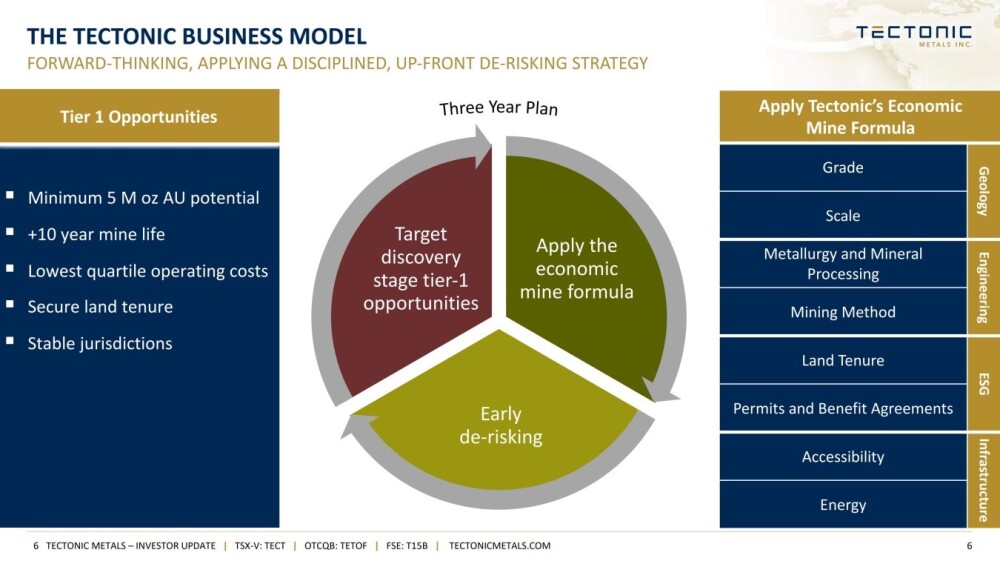
This slide explains Tectonic's business model and the early up-front de-risking strategy, which is or should be a comfort to shareholders.
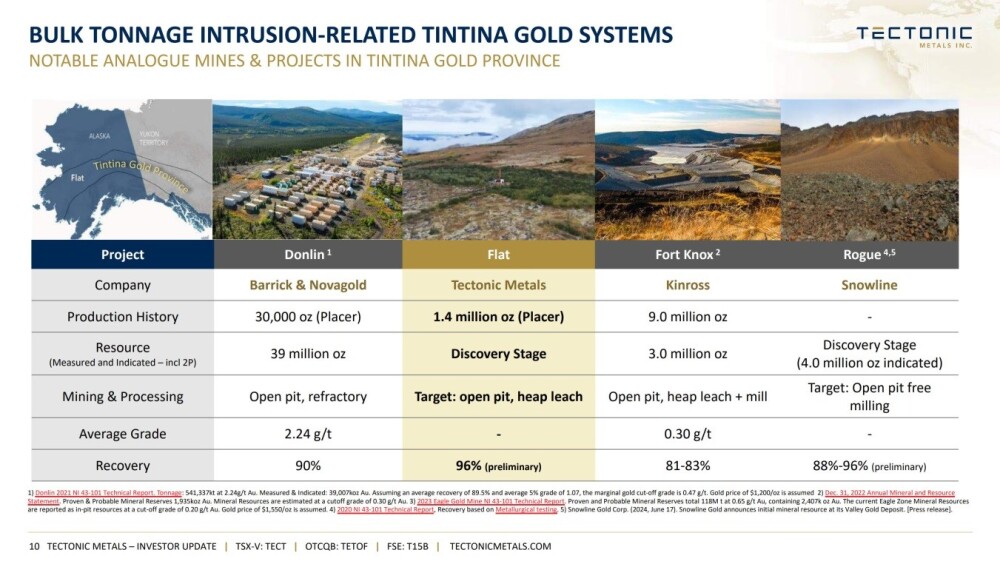
The following interesting slide shows how the company's Flat Project lies within the Tintina Gold Province, which runs right through Alaska and extends deep into the Yukon. and compares the Flat Project to other important projects along the belt owned by other major players.
There are some who would say that Kinross' Fort Knox Project probably contains more gold than the real Fort Knox.
The next slide shows the location of the Flat Gold System and overviews the project, showing the main targets within it.
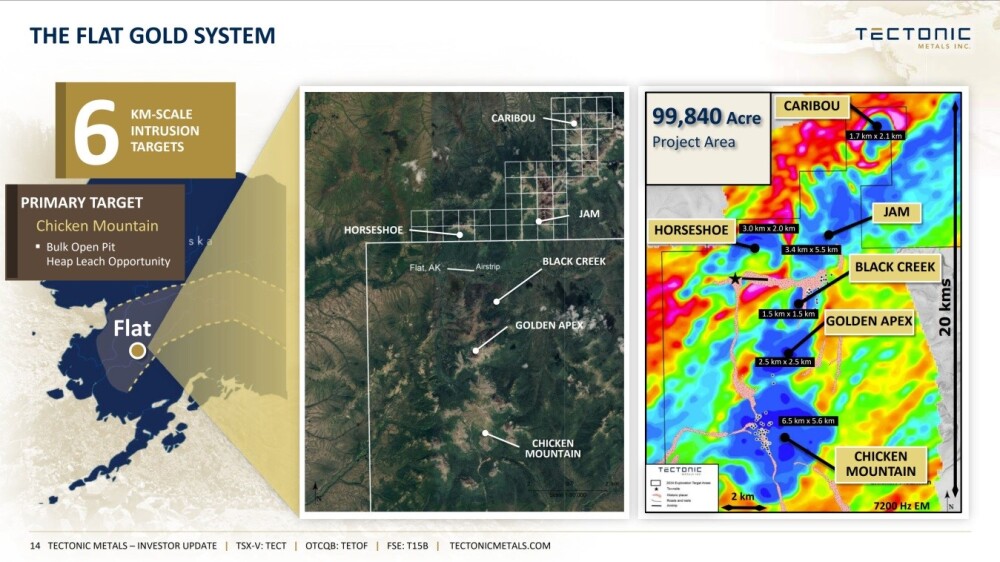
This map and table detail the main targets within the Flat Gold System.
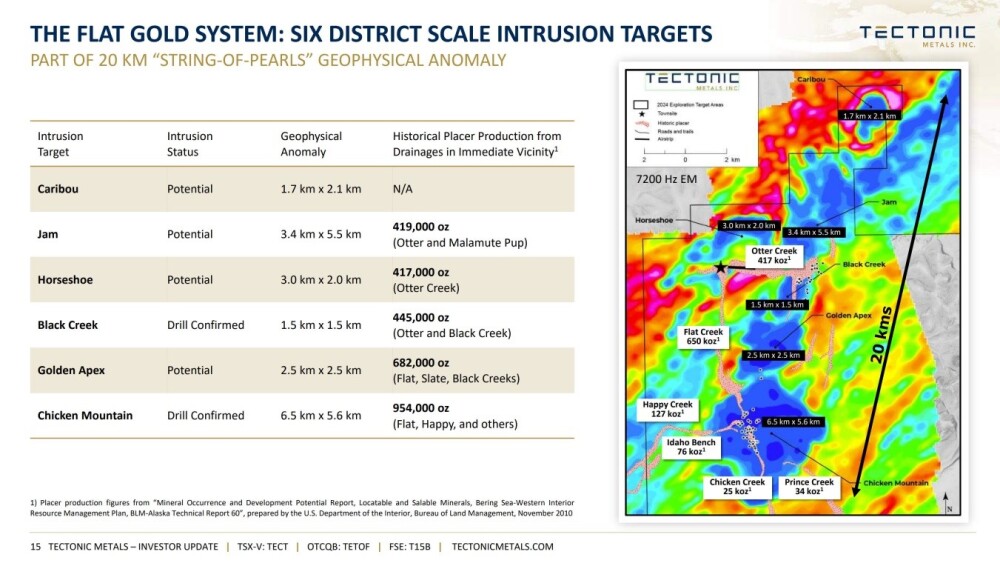
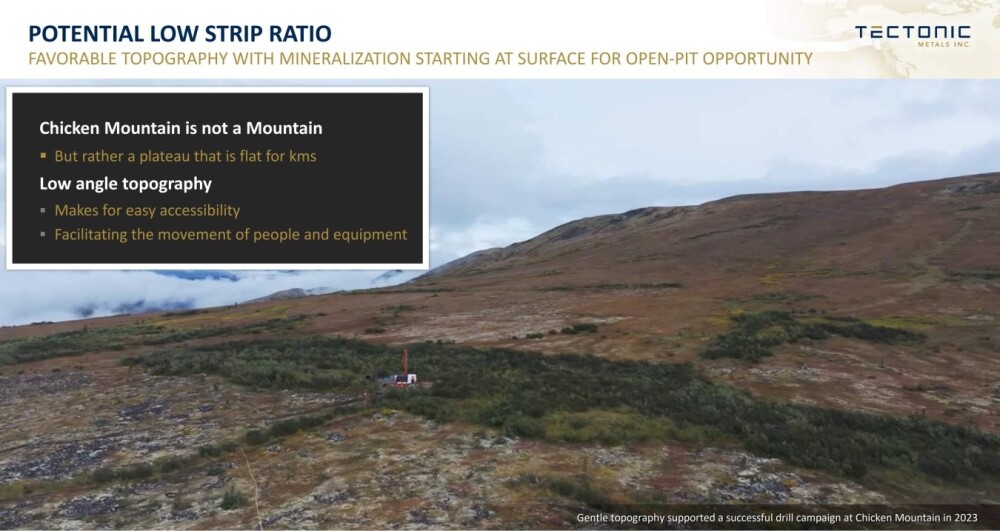
Within the Flat System, by far the most important target is the Chicken Mountain Intrusion, which has multi-million-ounce open-pit potential.
The name Chicken Mountain is a misnomer because it is not a mountain but a plateau with favorable topography for mining, and it is probably a double misnomer as it is very unlikely, given the latitude, that chickens are to be found there.
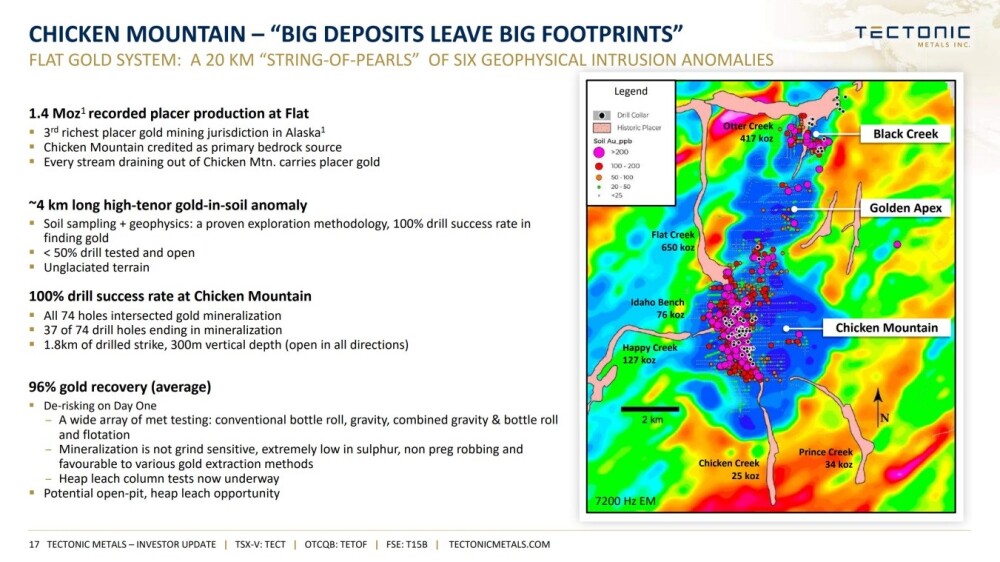
The following slide provides detailed insights into what is at Chicken Mountain, and it is remarkable that 100% of the 74 drill holes intersected gold mineralization, indicating a high probability that it is a big resource.
For much more information on the geology of Chicken Mountain and the other important targets at the Flat Project, please refer to the investor deck.
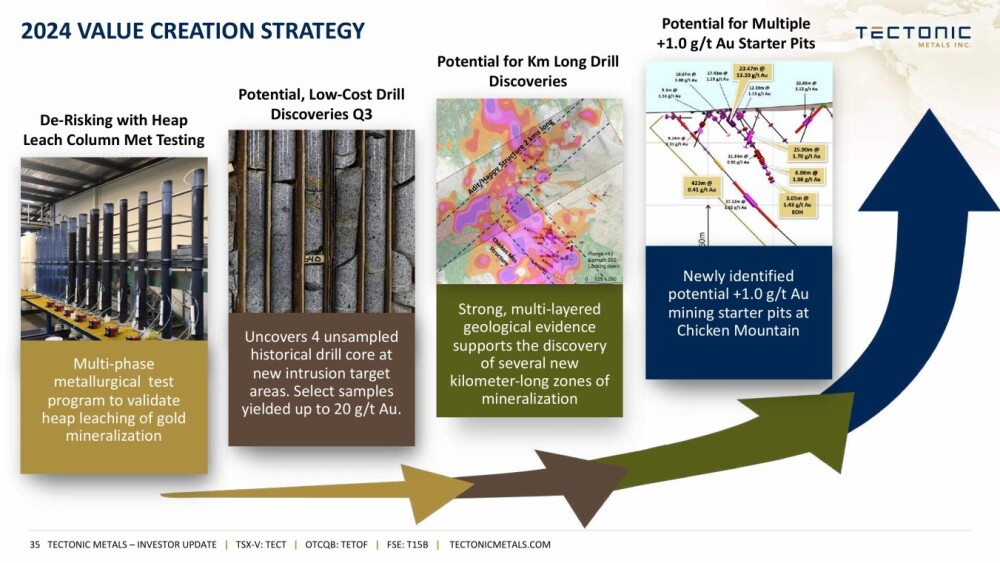
The next slide shows the 2024 value creation strategy, and a point to note is that the potential multiple "starter pits" will serve to create cash flow.
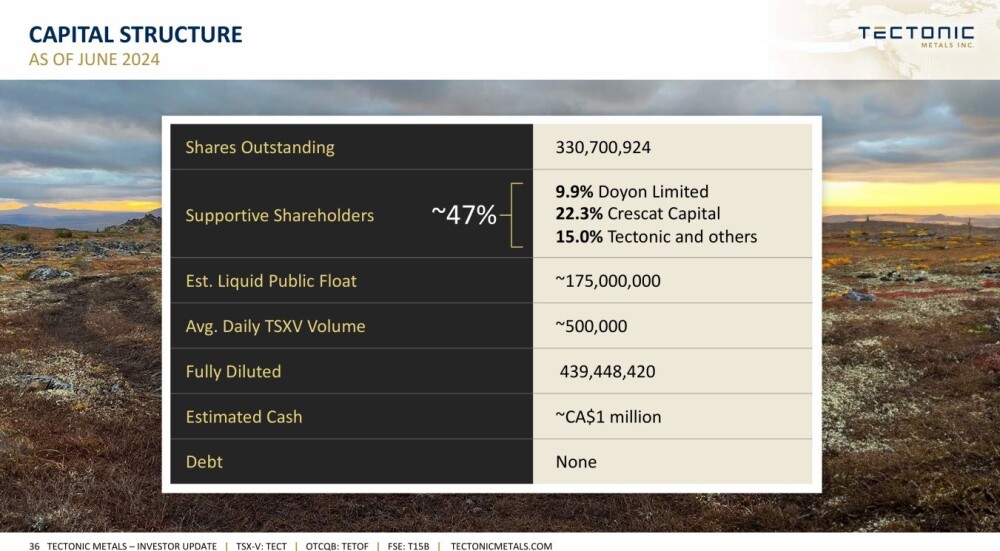
Finally, the last slide shows the capital structure and the most important point to note on this is that the "supportive shareholders" hold approximately 47% of the stock.
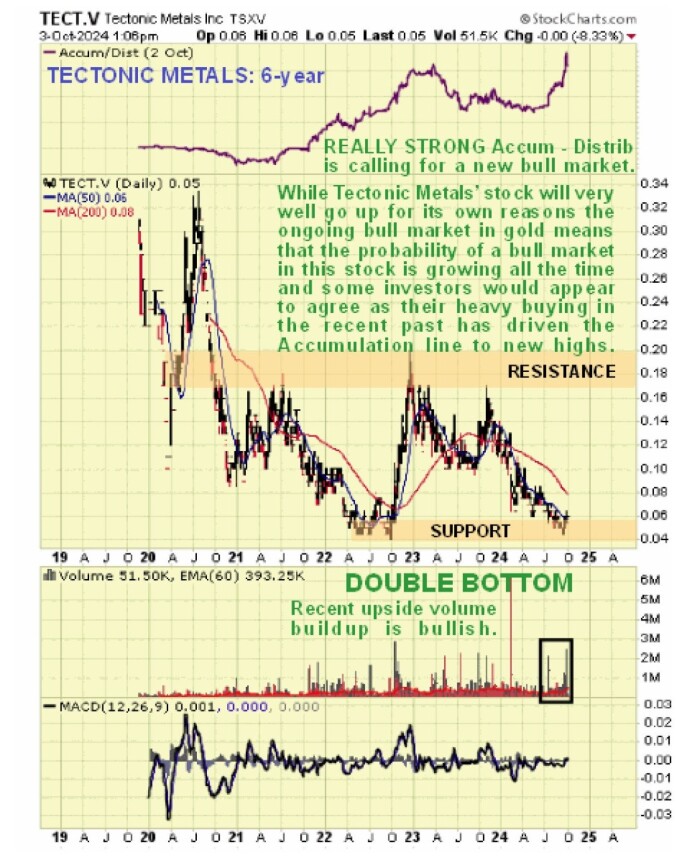
Turning now to the charts and starting with the long-term 6-year chart, we see that following a severe bear market that took it down from its mid-2020 highs above 33 cents to hit bottom late in 2022 at 4 cents, a giant Double Bottom base pattern has formed, with the first low around the time it bottomed in 2022 and the second low occurring just last month when it got down to 4.5 cents, so a shade above the 2022 lows.
Right now, it is just starting to rally out of these lows with the exceptionally positive volume pattern of recent weeks and strong Accumulation line that is already at new highs, suggesting that it won't tarry long at these low levels.
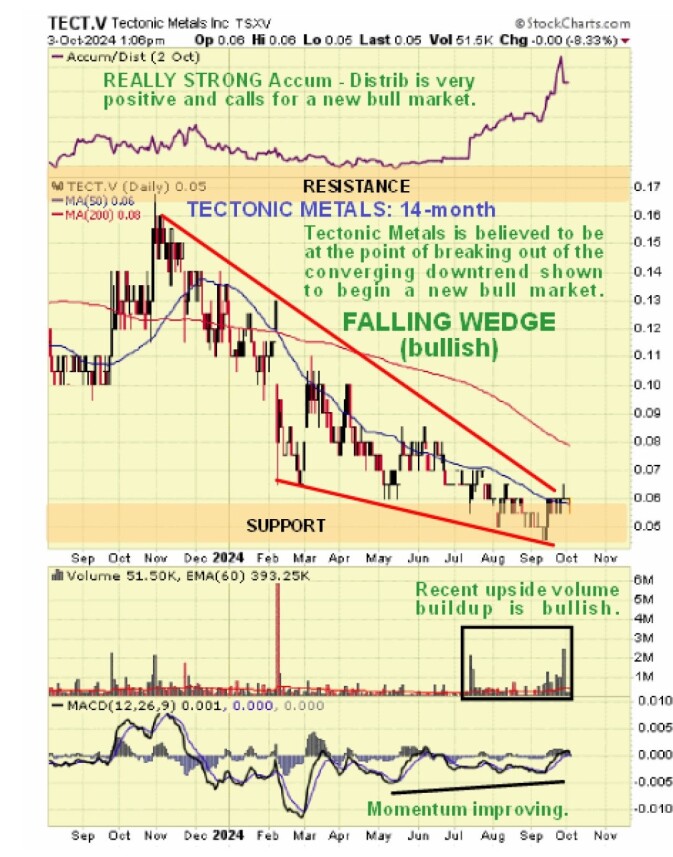
On the 14-month chart, we can see how the downtrend into the second low of the Double Bottom has taken the form of a Falling Wedge, which is indicative of dwindling downside momentum, which is a reason it is bullish in purport.
On this chart, we can also better see the marked buildup in upside volume in recent months and how it has driven the Accumulation line strongly higher, which are both strongly bullish indications. Currently, the price is very close to breaking out of the downtrend in force from last November, and given what we have just observed, a breakout looks likely very soon.
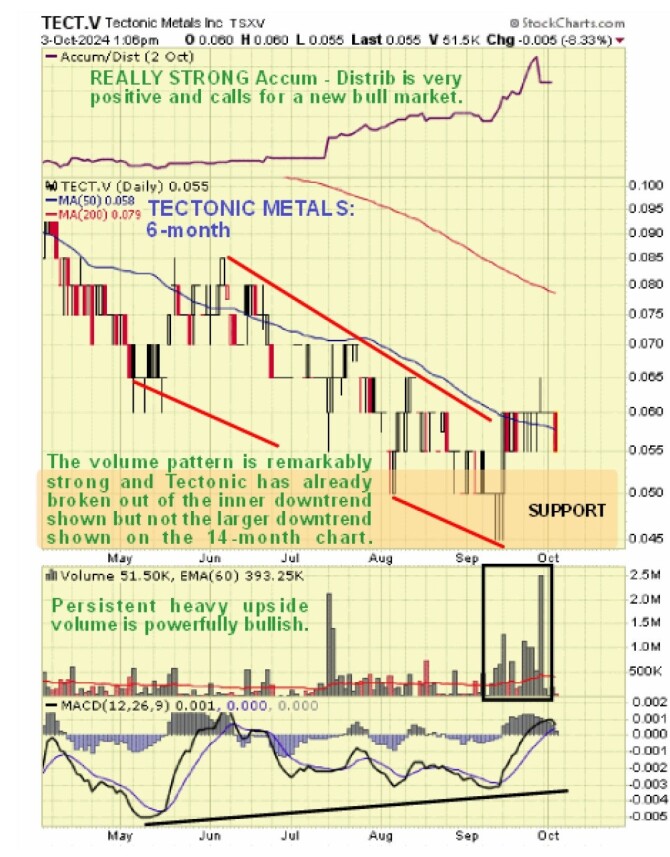
The 6-month chart is useful as it enables us to see more clearly the persistent strong upside volume since mid-July, which has driven the Accumulation line higher and ballooned in recent weeks.
This is a sign that somebody or something "knows something" and is accumulating the stock in an increasingly aggressive manner, and clearly, it is a very bullish indication.
With all these positive indications and the price still at a low level, this is clearly a good point to take positions in Tectonic Metals which is rated an Immediate Strong Buy here.
Tectonic Metals'