Crude Oil After November's Declines / Commodities / Crude Oil

Novemberwas the worst month for oil bulls since July 2016. Over the past few weeks, theprice of black gold has dived deeply, sometimes dropping even under the barrierof $50. What impact did this price action have on the long-, medium- andshort-term picture of the commodity?
Let's starttoday’s alert with the long-term chart (chartscourtesy of http://stockcharts.com).
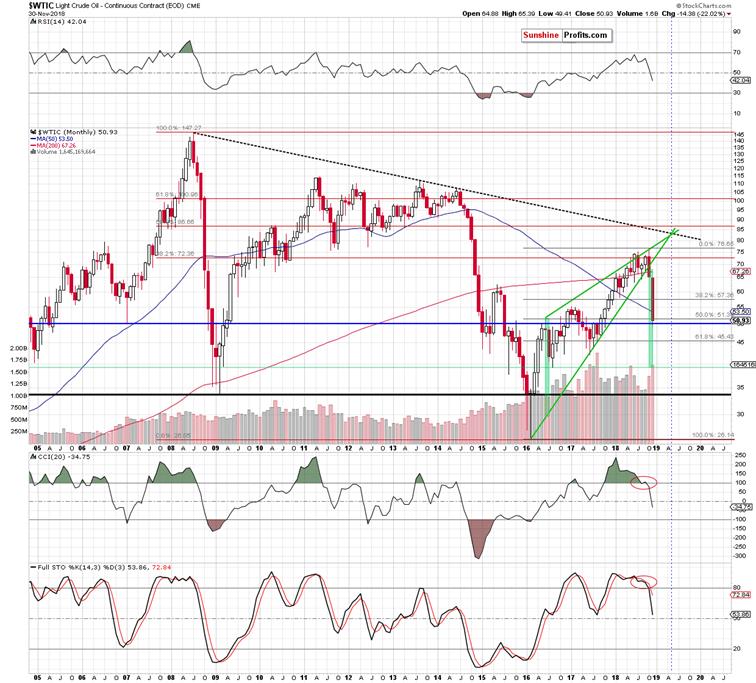
Looking atthe above chat, we see that October’s breakdown under the lower border of the green wedge,encouraged oil bears to show their claws. Thanks to their attack, the price oflight crude not only declined below the 38.2% or 50% Fibonacci retracements,but also under the 50-month moving average and the barrier of $50.
Fromtoday’s point of view, we see that oil bulls managed to trigger a reboundbefore the month’s closure, which saved them from the breakdown below theabove-mentioned psychologically important level of $50.
Nevertheless,size of the last week’s volume was huge, which confirms the sellers’ strength andtheir involvement in the November’s correction. Additionally, the sell signalsgenerated by the monthly indicators remain in the cards, suggesting that theworst might be still ahead of the buyers.
Are thereany positive technical factors on the horizon that can save the bull's skins?Let’s take a closer look at the medium-term chart.
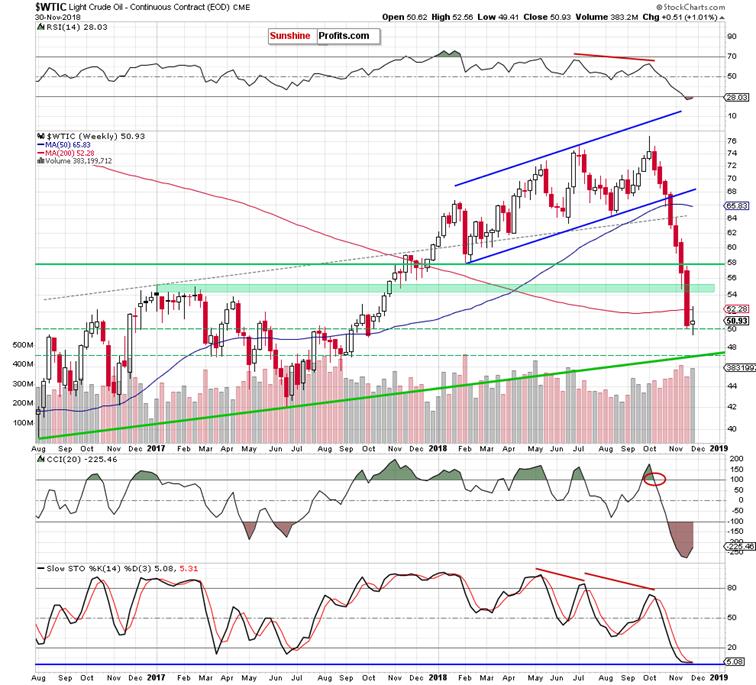
From thisperspective, we see that although the buyers closed the previous week above thebarrier of $50, the price of the commodity is still trading under thepreviously-broken 200-week moving average, which doesn’t look encouraging from thebulls’ point of view.
Why? Wethink that the best answer to this question will be the quote from ourTuesday’s alert:
(…) Such price action suggests that we could seenothing more than a verification of the earlier breakdown under this support.If this is the case, the price of light crude will likely move lower once againand test the recent lows, the barrier of $50 or even the supportarea created by the 76.4% and the 78.6% Fibonacci retracements (marked on thedaily chart (…) with the green horizontal dashed lines) in the followingdays.
On theother hand, the last week’s rebound materialized on higher volume than the earlierdecline, which suggests that higher prices might be just around the corner (IFoil bulls show strength in the coming week). This scenario is also reinforcedby the current position of the medium-term indicators, which are extremely oversold and close togenerating the buy signals.
Nevertheless,in our opinion, as long as there are no signs of the bulls’ strength openinglong positions is justified from the risk/reward perspective.
When canwe expect a more reliable improvement? In our opinion, such price action willbe more likely IF black gold successfully invalidates the earlier breakdownunder the above-mentioned 200-week moving average and the 50% Fibonacciretracement marked on the long-term chart.
Havingsaid the above, let’s analyze the short- and the very short-term changes.
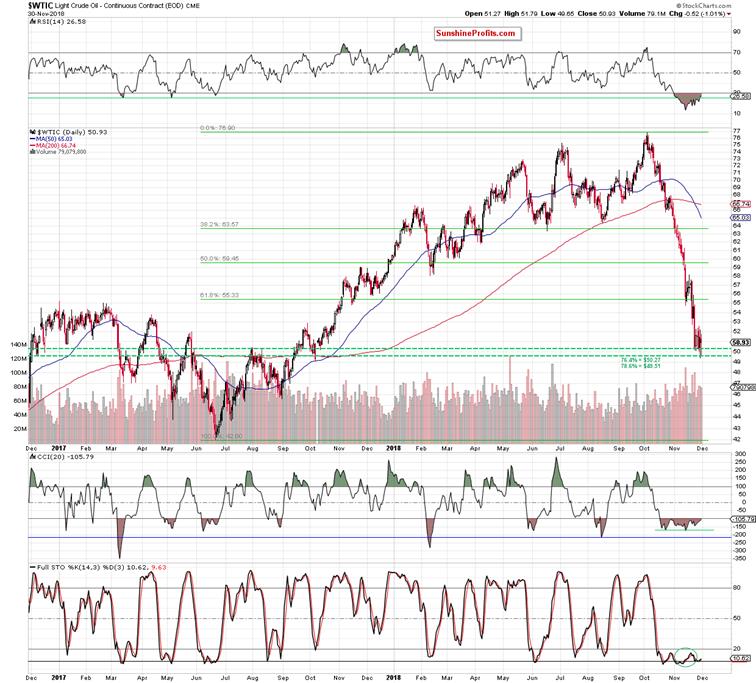
Looking atthe daily chart from a bit broader perspective, we see that light crude closedthe week above the support area created by the 76.4% and the 78.6% Fibonacci retracements (marked on with the green horizontal dashedlines), which is a positive sign. However, despite this price action there arestill no buy signals that could encourage buyers to operate more effectively.
Let’s zoomin our picture to see the recent price action more clearly.
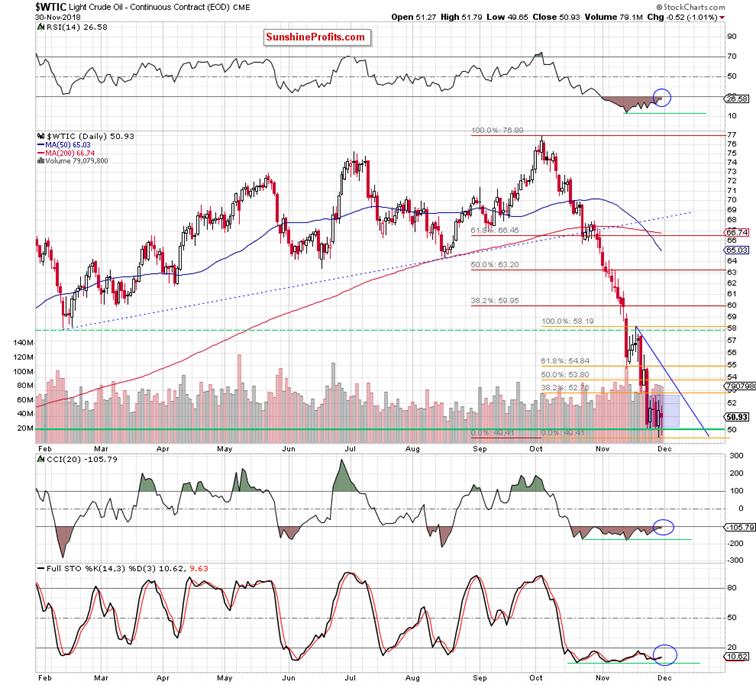
As you seeon the above chart, the overall situation in the very short term remains almostunchanged as crude oil is still trading in a narrow range (the blueconsolidation) between the barrier of $50 and the 38.2% Fibonacci retracementbased on the recent wave of the downward move (marked with orange).
Taking thisfact into account, we believe that as long as there is no breakout above the upper border of the formation and theabove-mentioned retracement (and also above the 200-week moving average, whichintersects and reinforces this resistance area) higher prices of black gold arenot likely to be seen – especially if we do not even see buy signals generatedby the daily indicators.
Finishingtoday’s alert, it’s worth noting that crude oil futures opened Monday’s tradingwith the gap, which suggests that further improvement might be just around thecorner. However, please not that if the buyers fail once again and do notmanage to break above the first resistance area, another test of the barrier of$50 and the above-mentioned supports can’t be ruled out.
If youenjoyed the above analysis and would like to receive free follow-ups, we encourageyou to sign up for our daily newsletter – it’s free and if you don’t like it,you can unsubscribe with just 2 clicks. If you sign up today, you’ll also get 7days of free access to our premium daily Oil Trading Alerts as well as Gold& Silver Trading Alerts. Signup now.
Nadia Simmons
Forex & Oil Trading Strategist
PrzemyslawRadomski
Founder, Editor-in-chief
Sunshine Profits: Gold & Silver, Forex,Bitcoin, Crude Oil & Stocks
Stay updated: sign up for our free mailing listtoday
* * * * *
Disclaimer
All essays, research andinformation found above represent analyses and opinions of Nadia Simmons andSunshine Profits' associates only. As such, it may prove wrong and be a subjectto change without notice. Opinions and analyses were based on data available toauthors of respective essays at the time of writing. Although the informationprovided above is based on careful research and sources that are believed to beaccurate, Nadia Simmons and his associates do not guarantee the accuracy orthoroughness of the data or information reported. The opinions published aboveare neither an offer nor a recommendation to purchase or sell any securities. NadiaSimmons is not a Registered Securities Advisor. By reading Nadia Simmons’reports you fully agree that he will not be held responsible or liable for anydecisions you make regarding any information provided in these reports.Investing, trading and speculation in any financial markets may involve highrisk of loss. Nadia Simmons, Sunshine Profits' employees and affiliates as wellas members of their families may have a short or long position in anysecurities, including those mentioned in any of the reports or essays, and maymake additional purchases and/or sales of those securities without notice.
© 2005-2018 http://www.MarketOracle.co.uk - The Market Oracle is a FREE Daily Financial Markets Analysis & Forecasting online publication.