Crude Oil Bulls, Are You Serious About Arresting the Slide? / Commodities / Crude Oil

We have said the bulls had abad day on Wednesday. How would you rate their yesterday’s performance? Heck,they are not having a good day today either. Black gold is heading for the biggestweekly loss in 2019. Has the support fallen out from below? Where can we expectthe decline to stop?
Let’s takea closer look at the chart below (charts courtesy of http://stockcharts.com).
We prescientlywrote these words on Wednesday:
(…) As wehave pointed to in our yesterday Alert's title ("The Shifting Sands in theOil Arena"), this suggests a bearish reversal of fortunes ahead. (…) Sucha move lower is supported by the unconvincingly low volume of the precedingupswing days.
Yesterday, we have added:
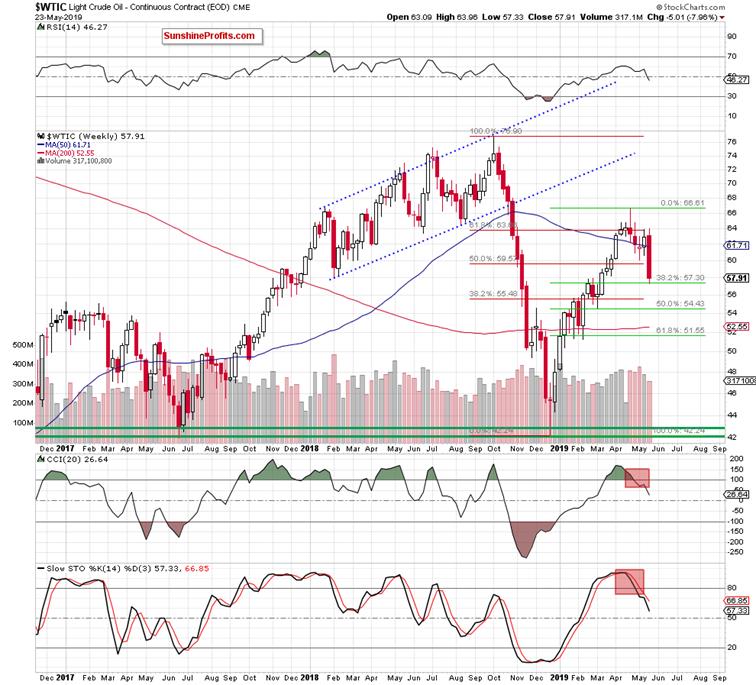
(…) thepreviously-broken 61.8% Fibonacci retracement stopped the buyers. Just like ithad stopped them last week too.
Black goldhas pulled back and slipped below the 50-week moving average. This couldtrigger further deterioration in the following days or even weeks. It'sespecially so when we factor in the sell signals of the weekly indicators.
Last twodays, black gold plunged like there’s no tomorrow. The large red candle hasmade our short positions even more profitable.
Let’s seethe reflection on the daily chart.
Beforeanswering this question, let’s recall our yesterday’s Alert again:
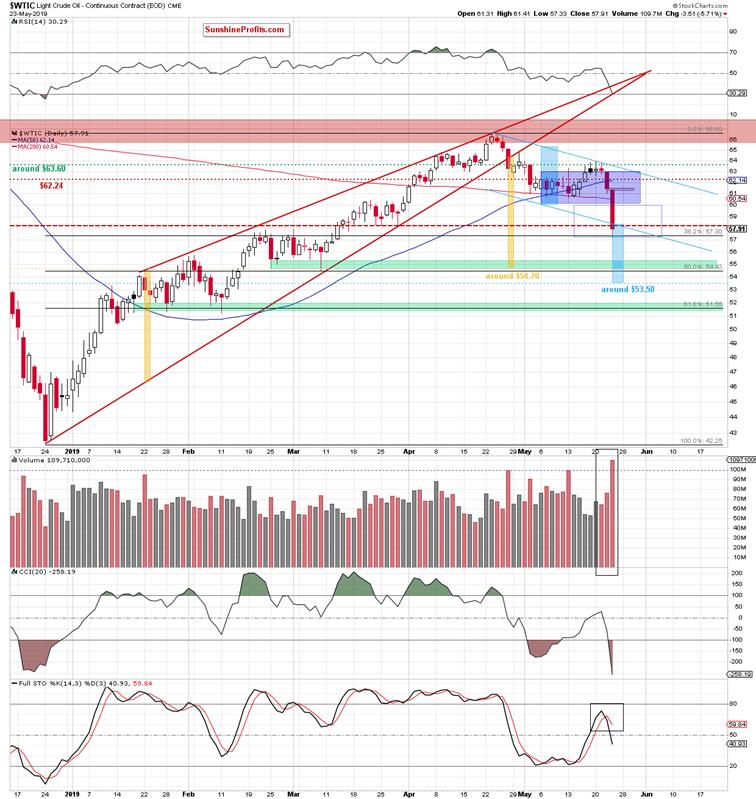
(…) Lightcrude not only declined below the previously-broken upper border of the blueconsolidation, but also closed the day below the 50-day moving average. Thisdoesn't bode well for higher prices ahead.
(…)Wednesday's downswing materialized on visibly higher volume than all thepreceding upswing days. This points to increasing participation of the sellersand their willingness to push prices even lower. Additionally, the StochasticOscillator's previous buy signal just turned into a sell signal.
These arenegative developments for the bulls. They hint at further deterioration in thecoming days. How low could crude oil go?
The firstdownside target for the sellers will be the lower border of the blueconsolidation (at around $60). (…) Should the bears succeed in getting a dailyclose below the blue consolidation in the coming days, the probability oftesting the late-March lows will increase significantly.
Oil bearsnot only took the commodity below the lower border of the blue consolidationbut also managed to reach two important areas. First, it’s the 38.2% Fibonacci retracement and then, the area where the size of thedownward move corresponds to the height of the blue consolidation.
Some bearstook profits off the table yesterday, and black gold slightly rebounded. Crudeoil however still finished the day below the late-March lows (the dashed redhorizontal line is based on them and serves as a resistance). Coupled with the weekly picture, theposition of the daily Stochastic Oscillator and the significant volume of yesterday’s sharp decline, furtherdeterioration may be just around the corner.
Indeed, today’s recovery attempt hasfizzled out and at the moment of writing these words, oil trades at around$57.70. The bearish onslaught continues.
Thisscenario is also reinforced by the fact that yesterday’s drop took light crudebelow the lower border of the declining blue trend channel. If the commodityextends losses from here, we could see a drop even to around $53.50, where thesize of the decline corresponds to the height of the channel.
But thefirst target for the sellers will be a bit higher – at around $54.70, where thesize of the downward move equals the height of the rising red wedge (as markedwith yellow rectangles).
This isthe area marked by the 50% Fibonacci retracement, the late-February andearly-March lows. They together create the green zone serving as the nextimportant support for the bulls.
As if thepicture wasn’t bearish enough already, let’s mention one more thing. It’s thegap between Wednesday’s close and Thursday’s open. It serves as an importantresistance now. Let’s have a look where saw a similar price action in the pastalready.
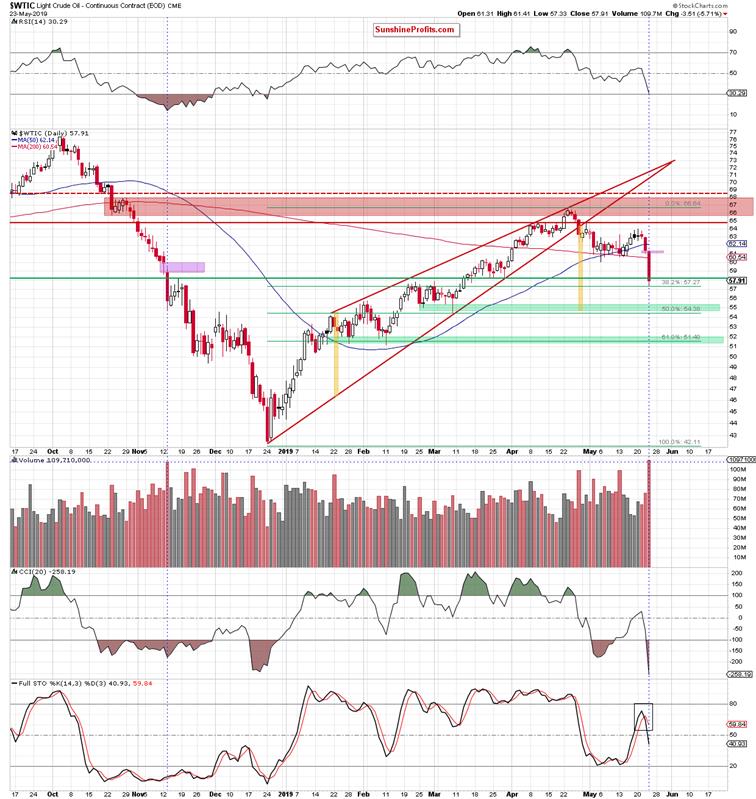
Crude oilhas created a similar gap in November 2018 – that’s not too far fromyesterday’s gap. Back then, oil bears also created a long red candlestick onvery high volume (it’s marked with a blue vertical line). There was an attemptto repair the damage in the following days but the bulls’ efforts failed aftera few days, and light crude declined again.
Summingup, the outlook for oil is bearish. As the bulls havebeen unable to overcome the previously-broken red horizontal line and the 50% Fibonacci retracement severaldays in a row, last two days revealed their weakness in full. Oil truly plungedand marches lower also today. Both the weekly and daily indicators continue tosupport lower prices. The daily volume examination concurs and the shortposition continues to be justified.
Today's article is a smallsample of what our subscribers (and sometimes members of our free mailing list)enjoy regularly. The full version of today’s analysis digging even deeper intothe downside targets question can be accessed on our website in the free articles section. There’re also other recent free articles. You arewelcome to drop by anytime and have a look.
Nadia Simmons
Forex & Oil Trading Strategist
PrzemyslawRadomski
Founder, Editor-in-chief
Sunshine Profits: Gold & Silver, Forex,Bitcoin, Crude Oil & Stocks
Stay updated: sign up for our free mailing listtoday
* * * * *
Disclaimer
All essays, research andinformation found above represent analyses and opinions of Nadia Simmons andSunshine Profits' associates only. As such, it may prove wrong and be a subjectto change without notice. Opinions and analyses were based on data available toauthors of respective essays at the time of writing. Although the informationprovided above is based on careful research and sources that are believed to beaccurate, Nadia Simmons and his associates do not guarantee the accuracy orthoroughness of the data or information reported. The opinions published aboveare neither an offer nor a recommendation to purchase or sell any securities. NadiaSimmons is not a Registered Securities Advisor. By reading Nadia Simmons’reports you fully agree that he will not be held responsible or liable for anydecisions you make regarding any information provided in these reports.Investing, trading and speculation in any financial markets may involve highrisk of loss. Nadia Simmons, Sunshine Profits' employees and affiliates as wellas members of their families may have a short or long position in anysecurities, including those mentioned in any of the reports or essays, and maymake additional purchases and/or sales of those securities without notice.
© 2005-2019 http://www.MarketOracle.co.uk - The Market Oracle is a FREE Daily Financial Markets Analysis & Forecasting online publication.