Crude Oil - How Many Minutes to Midnight Before We Act? / Commodities / Crude Oil

Yesterday,some might have wondered where is the limit to the upswing in oil. It would benatural to expect it to catch up to e.g. gold and silver upswings. Would be,could be. We just saw something that made us act. Diligently, with foresightand confidence – when the odds are with us. It’s time to share it with you.
Let’sexamine the charts below to find out (chartscourtesy of http://stockcharts.com).
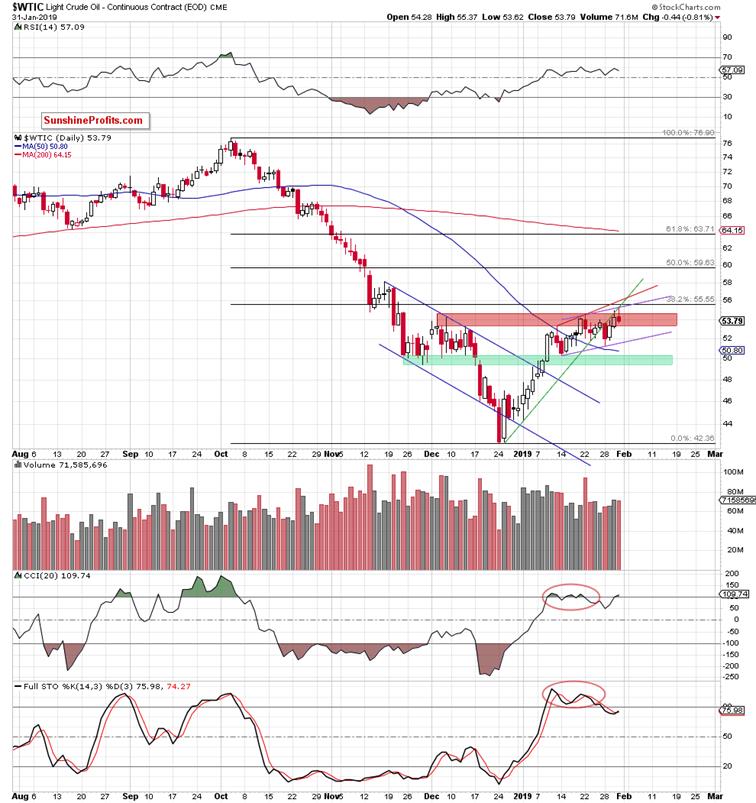
Yesterday,crude oil broke above December peaks and hit a fresh January high on intradaybasis. The buyers, however, showed hesitation and didn’t close the day on astrong note at all. The long upper knot and especially the close near the dailylows clearly show that – this is what a reversal looks like. The volume wasnot too shabby, giving credibility to the rejection of upside move.
Yousee, that is the strength of the proximity of 38.2% Fibonacci retracement and of another verificationof the previously-broken green line. Now we have three daily closes below itwhich makes its breakdown confirmed. Black gold also climbed to the upperborder of the very short-term purple rising trend channel – and again wasrejected at it.
Allthese illustrate the weakness of the buyers and correspondingly increases ourconfidence in taking action. We are glad we can share this opportunity withyou.
Ontop of that, the commodity closed another day below the upper border of the redresistance zone based on the December peak. It looks like the entry of oilbears to the trading floor in earnest is just around the corner.
Interestingly,the CCI invalidated its earlier sell signal, while the Stochastic Oscillatorgenerated a buy one, but taking into account their recent action we do nottrust them enough to base investment decisions on their signals alone. Theseand so many other indicators are derivatives of the price, meaning that theyare lagging behind it. In other words, it is first about the price and onlythen about the indicator.
So,what do we base our decisions on? We believe in price action and technical analysis, which tell us that loweroil prices are only a matter of time (and a very short one at that) –especially when we factor in the situation the following key ratios.
Crude Oil – Gold Link – Divergence at First Sight
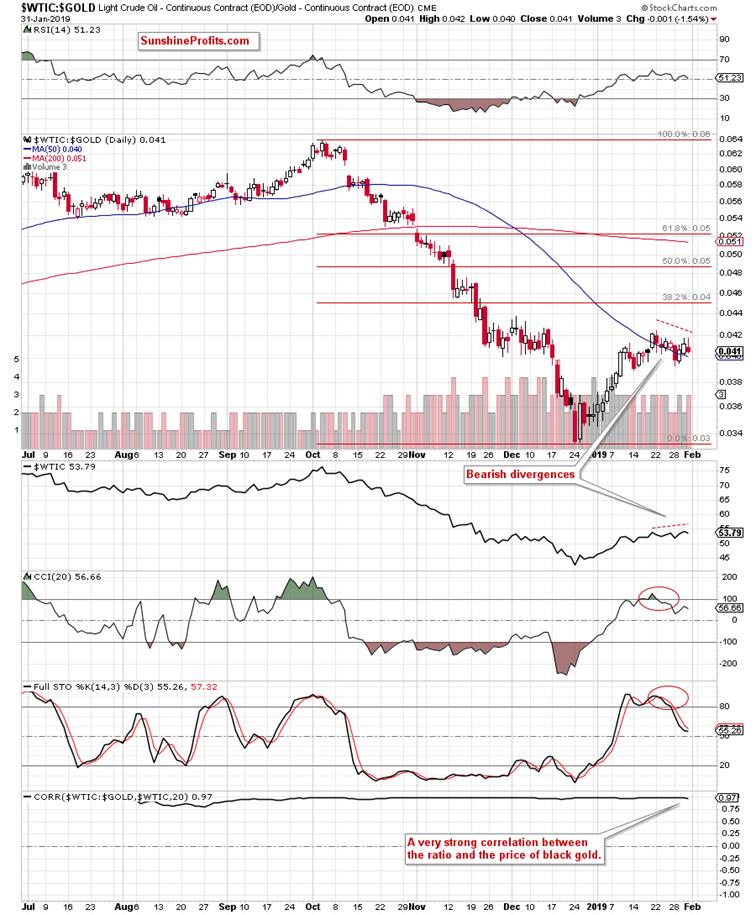
Fromthis perspective, we see that a very strong correlation between the ratio andthe price of black gold remains on the cards for many months. No wonder, crudeoil is in the numerator of the ratio.
However,we noticed something interesting, which can translate into another profitableopportunity similar to us riding the downtrend since the topping process inearly October. Back then, we opened the short position on Oct 5th and partiallyclosed it on Oct 12th to capture almost $5 dollars of the move – and got outlater with the rest for even more. Our subscribers were prepared. But what dowe mean by something interesting?
Analyzingthe charts, we discovered that although both crude oil and gold hit freshJanuary highs during their recent sessions, the same was not true in the caseof the oil-gold ratio. Whyshould we care?
Itis a clear bearish divergence as crude oil is making alocal high and gold even more so, yet the ratio doesn't follow. And it isimportant because gold and gold-oil ratio are so strongly positively correlated. Therefore, the odds arethat oil will follow the ratio down as the ratio is not making a new high whileoil is.
Additionally,when we compare the daily chart of crude oil and the ratio, we clearly see thatthe latter is much lower in relation to the 38.2% Fibonacci retracement andDecember peaks than the price of the commodity itself, which we can read asanother bearish signal.
Ontop of that, when we focus on the weekly chart of our oil-gold ratio, we seethat it didn’t even manage to break above the 200-week moving average in recentweeks.
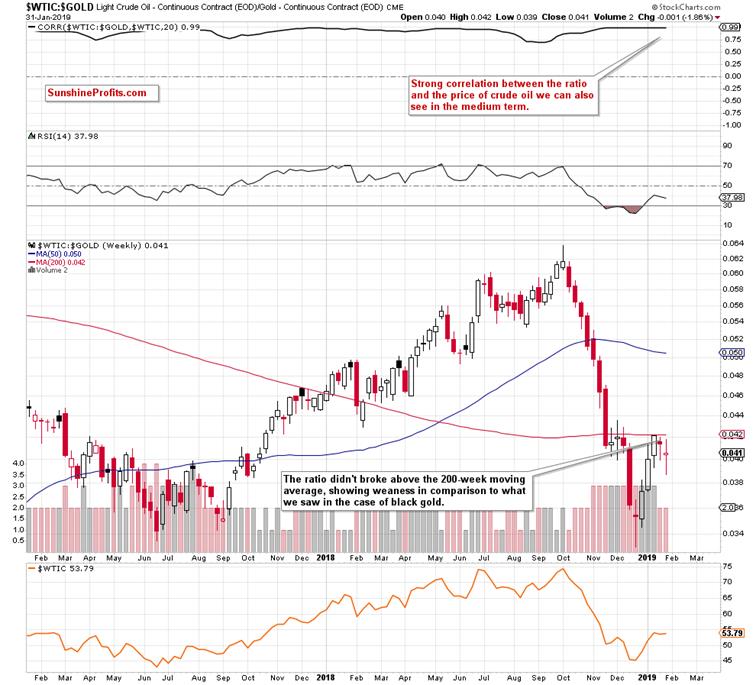
Suchprice action is an additional bearish factor, which increases the probabilityof oil price reversal from the current levels in the very near future.
Wealways want many factors pointing in the same direction to maximize odds in ourfavor. This is what prudent trading is about – the patience to wait for whenthe opportunity presents itself.
Willthe analysis of oil-silver ratio add further bearish arguments?
Crude Oil – Silver Ratio – Another Divergence in PlainSight
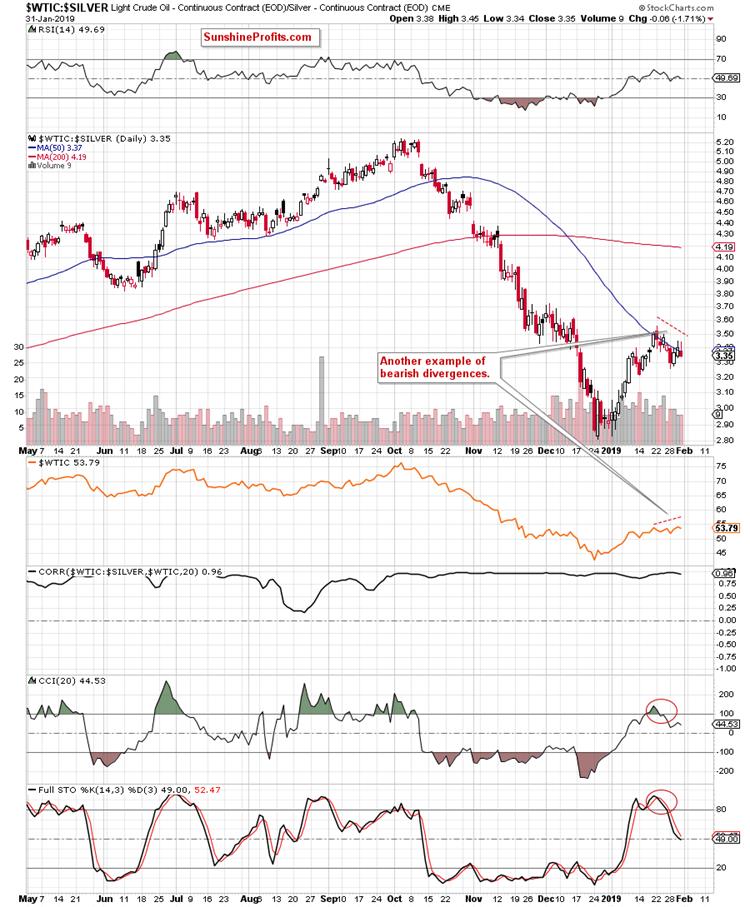
Wash,rinse, repeat. Again, the bearish divergence between the ratio and black goldprice is the first thing that catches the eye on the daily chart.
It'snot only that. We see one more sign of weakness, this time in the ratio itself.Take a look at the 50-day moving average. From today’s point of view, we seethat the ratio broke above it only yesterday while the oil did that in themiddle of the month already. This emphasizes the weakness of the ratio inrelation to the price of the commodity itself. Remember that the ratios areleading indicators – the same relationship exists in the gold market itselfbetween gold price and gold miners' price. You can exploit this and many othertools in our Gold Trading Alerts.
That'sall very fine but what does it all mean for us in practice?
Aswe mentioned earlier, there is a very strong correlation between crude oiland the oil-to-gold ratio. We can observe the same in the case of theoil-to-silver ratio. This means that if the ratios move lower in thevery near future, there is a high probability that the price of light crudewill do the same – just like it did many times in the past.
Therefore,keeping an eye on their behavior may be a good confirmation of the decision toopen short positions in crude oil in the very near future.
Beforesummarizing, we would like to add one more thing. Despite yesterday’s freshprice peak in crude oil, note that the oil-to-gold ratio didn’t even climbabove Wednesday’s high, which again underlines the weakness of the bulls.
Additionally,the ratio is still trading below its 200-week moving average, while theoil-to-silver ratio invalidated Wednesday’s tiny breakout above its 50-daymoving average. This further supports the bearish case.
Summing up, crude oil hit a freshJanuary peak, re-approaching the 38.2% Fibonacci retracement and the upper lineof the very short-term trend channel. There was no breakout above them,suggesting that the buyers are likely losing strength. Black gold also verifiedthe earlier breakdown under the green support line (the one based on theDecember and January lows) and confirmed it by closing below for the third timein a row. On top of that, we haven’t seen correspondingly bullish action in itsleading ratios, which suggests reversal in oil price soon.
If youenjoyed the above analysis and would like to receive free follow-ups, we encourageyou to sign up for our daily newsletter – it’s free and if you don’t like it,you can unsubscribe with just 2 clicks. If you sign up today, you’ll also get 7days of free access to our premium daily Oil Trading Alerts as well as Gold& Silver Trading Alerts. Signup now.
Nadia Simmons
Forex & Oil Trading Strategist
PrzemyslawRadomski
Founder, Editor-in-chief
Sunshine Profits: Gold & Silver, Forex,Bitcoin, Crude Oil & Stocks
Stay updated: sign up for our free mailing listtoday
* * * * *
Disclaimer
All essays, research andinformation found above represent analyses and opinions of Nadia Simmons andSunshine Profits' associates only. As such, it may prove wrong and be a subjectto change without notice. Opinions and analyses were based on data available toauthors of respective essays at the time of writing. Although the informationprovided above is based on careful research and sources that are believed to beaccurate, Nadia Simmons and his associates do not guarantee the accuracy orthoroughness of the data or information reported. The opinions published aboveare neither an offer nor a recommendation to purchase or sell any securities. NadiaSimmons is not a Registered Securities Advisor. By reading Nadia Simmons’reports you fully agree that he will not be held responsible or liable for anydecisions you make regarding any information provided in these reports.Investing, trading and speculation in any financial markets may involve highrisk of loss. Nadia Simmons, Sunshine Profits' employees and affiliates as wellas members of their families may have a short or long position in anysecurities, including those mentioned in any of the reports or essays, and maymake additional purchases and/or sales of those securities without notice.
© 2005-2019 http://www.MarketOracle.co.uk - The Market Oracle is a FREE Daily Financial Markets Analysis & Forecasting online publication.