Crude Oil Price - Who Wants the Triangle? / Commodities / Crude Oil

 On Thursday crude oil wavered between smallgains and losses, but finished the day only 23 cents above Wednesday closingprice. Such small daily changes that we observe recently don’t look too encouragingfor oil bulls or for the bears. However, to dispel boredom, we rummaged deeper inthe charts and we found something that may interest both sides of the market’sbattle. Curious?
Nevertheless, before we get to our littlesurprise, we would like to draw your attention to news from the IEA. Yesterday, the International Energy Agency saidthat global oil supply increased by 700,000 barrels per day from a year ago inthe previous month. Additionally, we find out that supplies from producersoutside of the OPEC will grow by 1.8 million bpd this year versus an increaseof 760,000 bpd last year (mainly due to the rapidly growing production in the U.S.).
Such information (especially in connection with theprevious reports from this month about which you could read in our March alerts)doesn’t bode too well for higher prices, increasing worries that rising supplyfrom the U.S. and other nations could spoil efforts made by OPEC and otherproducers to tighten the market.
Is the fundamental picture of crude oil the onlyone who suggest that the lower prices are just around the corner? Let's take a closer lookat the charts below to find out (charts courtesy of http://stockcharts.com).
Technical Analysis of Crude Oil
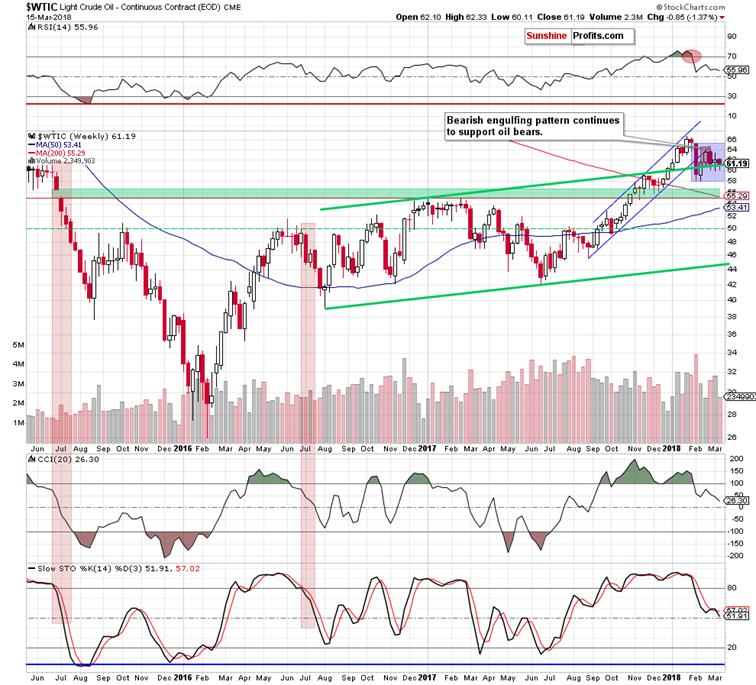
Looking at themedium-term picture of the commodity, we see that the situation remains almostunchanged as the previously-broken upper border of the green rising trend channel continues to keep declines in check.Additionally, black gold is still trading in the blue consolidation, whichraises the importance of this area for both sides of the market.
Nevertheless,the sell signals generated by all indicators remain in the cards, supporting thesellers as well as the bearish engulfing pattern, which strengthens theblockade of the road to the north.
So, if themedium-term picture may raise some doubts about the direction of the next biggermovement, is it possible that the short-term changes give us credible hintsabout the future of crude oil? Let's check it.
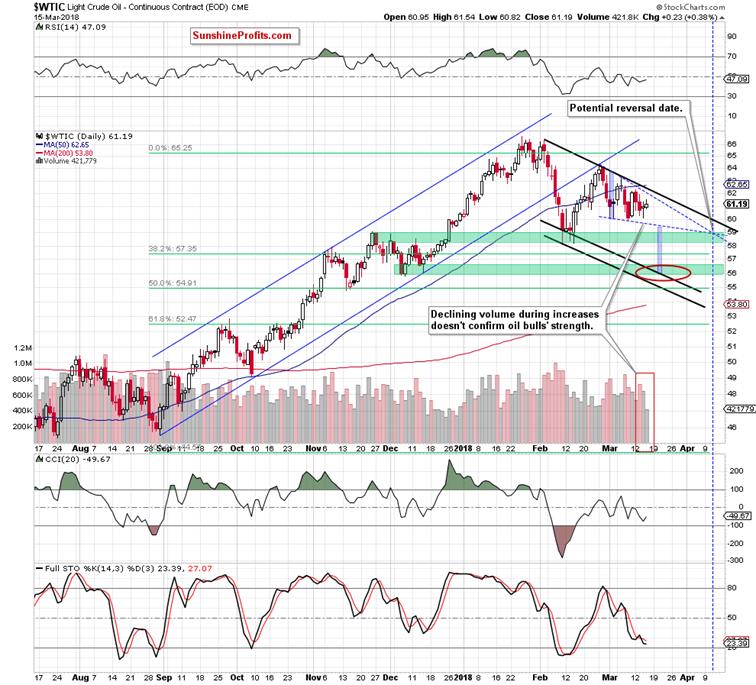
At the firstglance, we could write that the situation doesn’t look much better from thisperspective, because crude oil still remains in a very short-term consolidationbetween the barrier of $60 and the black declining resistance line based on theprevious highs (a potential upper border of declining trend channel), which iscurrently reinforced by the previously-broken 50-day moving average.
After this extended sentence,you could ask: “so… that's all you have to say?” We would not be surprised by,for example, such a comment: “I’m not interested in these two consolidations, Iwant to know what will happen next!”
Before negative emotionsarise, please pay attention to the beginning of the first sentence under thechart... at the first glance…
You know us for a long (or short)time and you know that we would not be ourselves if we did not dig deeper inthe charts to come up against your questions and doubts. So, instead ofcomplaining about consolidations, let's take a closer look at the bullish andthe bearish arguments.
What the buyers have on their side?Two important supports: the above-mentioned, previously-broken upper border of the green risingtrend channel and the barrier of $60.
What weapons do their opponents haveat the moment of writing these words?
SixReasons Why Oil Bears Could Win
The first one is the verification ofthe breakdown under the lower border of the blue rising trend channel, whichtriggered a decline to the level of $60.
The second is the proximity to theabove-mentioned black declining resistance line based on the previous highs and the 50-daymoving average.
The third isdeclining volume during recent increases. As you see the history repeats itselfonce again, indicating that the upward move not supported by the increasing volume may end with reversal once again.
The fourthis the re-generated by the Stochastic Oscillator sell signal. When we take acloser look at the daily chart, we notice that this is a repeat what we alreadysaw on March 7. What happened in the following days? The price of crude oilextended losses, re-testing the barrier of $60.
The fifth isthe long-term picture of crude oil. Let’s examine the monthly chart.
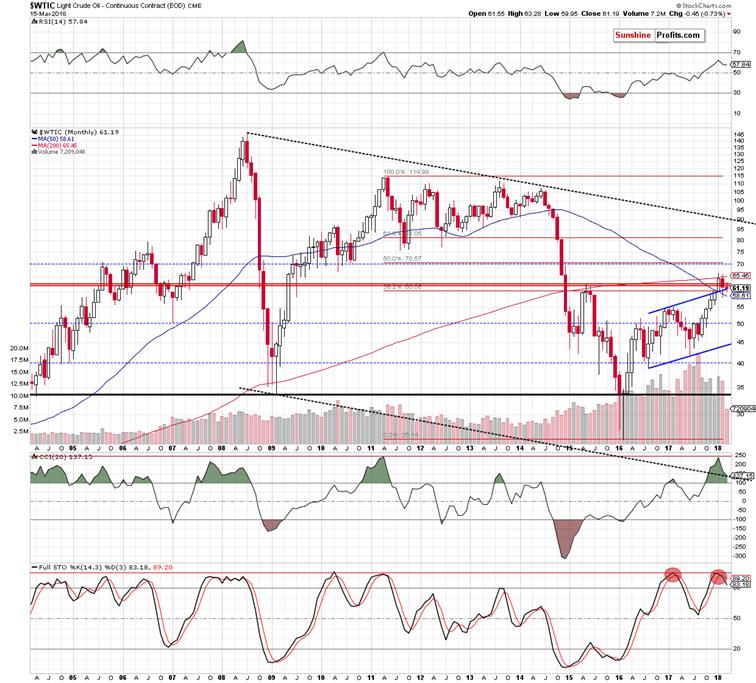
From thisperspective we see that crude oil is trading not only under the May 2015 peakand the 200-month moving average, but also slipped below the 38.2% Fibonacci retracement.
Additionally,the sell signal generated by the Stochastic Oscillator continues to support thebears. What’s interesting, the last time when we saw such situation was a yearago. Back then, the sell signal preceded a bigger decline, which took crude oilto almost $42 in the following months.
Butreturning to the bear arguments… we found something else.
The sixthargument is the similarity to the past.
What do wemean by that? Looking at the daily chart, you probably noticed a blue triangle,which limits the price fluctuations since the beginning of the month. At thispoint, you should remember that the triangle is first of all an example ofconsolidation, and each consolidation causes the market to wait for a goodmoment to enter. After clear movement, prices fluctuate up and down, andinvestors are eagerly awaiting the opportunity to start another strong wave ofpurchases or sales.
If you are interesteda bit more in technical analysis, you probably read that triangles can beformations of continuation or reversal of the trend - depending on the context(starting from the direction of the triangle, through indicators and ending with the general fundamentalsituation on the market). We, however, examined them from a completelydifferent side.
Mambo No.5? No, Triangle Number 5
Have youever heard about the triangle apex reversal? That’s the name for a little-known, buteffective and useful technique for detecting reversals. Some time ago, wetested it on the precious metals market and today we would like to show you howtriangles work on crude oil charts.
Let’s take alook at the daily chart once again, but this time from a wider perspective.
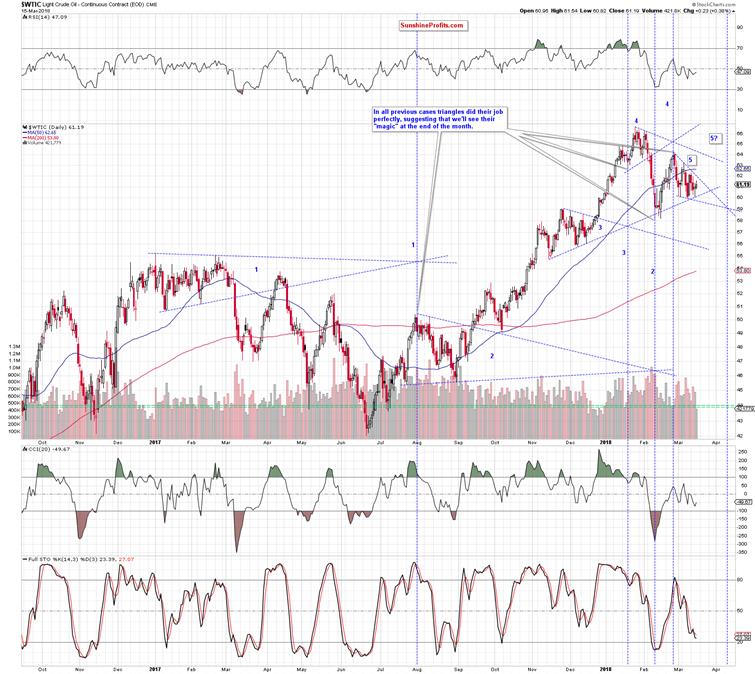
As you seeon the above chart the first triangle was created at the beginning of theprevious year by the resistance line based on the January and February 2017highs and the support line based on the January and February lows. Where didthey intersect? Around the beginning of August 2017, which resulted in areversal and a bigger move to the downside, which pushed the price of thecommodity lower and lower throughout the month.
The secondtriangle was based on the resistance line created by the August 207 peaks andthe support line created by the late July and August 2017 lows. This time the intersectionof these lines occurred on February 9 and translated into the rebound, which weobserved for most of the previous month.
Anotherexample? Here you are. The triangle number 3. It was created by the resistanceline based on the November and mid-December highs and the support line based onthe mid-November and early December lows. Where did these lines cross? OnJanuary 19 and triggered the final wave of the crude oil’s rally.
The trianglenumber 4 was smaller than its predecessors, but it worked, indicating that the reversalwill take place around February 26.
After thisshort trip to the past, it's time for the above-mentioned blue triangle, which you saw on the first daily chart. What doesits presence on the chart mean for crude oil? No less no more than the factthat if history repeats itself once again, the intersection of its lines willtake place around April 10.
The mostinteresting is that this date is confirmed by two more triangles, which wefound on the weekly chart. See for yourself.
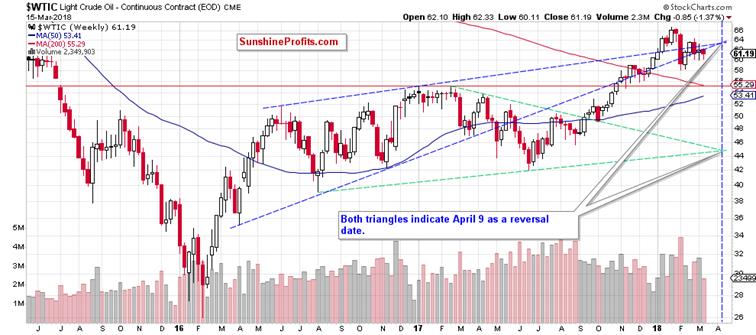
From thisperspective, we see that the blue triangle is created by the resistance linebased on the June 2016 and January 2017 peaks and the support line based on theApril 2016 low and mid-November 2016 low. The green triangle is created by theresistance line based on the February and April 2017 highs and the support linebased on the August 2016 and June 2017 lows.
Additionally,analyzing the above chart, we noticed that April 4, 2016 and April 10, 2017 broughtreversals, which increases the probability that we’ll likely similar priceaction in the coming month.
Will April 9, 2018 show the short-termbottom or the top? At the moment of writing these words, we can’t be absolutelysure as there are no sure bets in any market, only bigger and smaller chancesof something working. Nevertheless, all the above-mentioned fundamental andtechnical factors clearly show that oil bears have more arguments on their side,which should translate into further deterioration in the coming week(s).
So how low could black go if we see arealization of the bearish scenario?
If the commodity extends losses and breaks under the lower line of thetriangle, the first downside target will be February lows around $58. If they are broken,oil bears will likely push the commodity to December or November 2017 lows (wemarked this area with the red ellipse). If they do not stop declines, the nextdownside targets will be around $53.50-$53.65, where the April 2017 peaks andthe 61.8% Fibonacci retracement are. At this point it is worth noting, thatthis area will be likely reinforced also by the lower border of the blackdeclining in the coming week(s).
If youenjoyed the above analysis and would like to receive free follow-ups, we encourageyou to sign up for our daily newsletter – it’s free and if you don’t like it,you can unsubscribe with just 2 clicks. If you sign up today, you’ll also get 7days of free access to our premium daily Oil Trading Alerts as well as Gold& Silver Trading Alerts. Signup now.
Thank you.
Nadia Simmons
Forex & Oil Trading Strategist
PrzemyslawRadomski
Founder, Editor-in-chief
Sunshine Profits: Gold & Silver, Forex,Bitcoin, Crude Oil & Stocks
Stay updated: sign up for our free mailing listtoday
* * * * *
Disclaimer
All essays, research andinformation found above represent analyses and opinions of Nadia Simmons andSunshine Profits' associates only. As such, it may prove wrong and be a subjectto change without notice. Opinions and analyses were based on data available toauthors of respective essays at the time of writing. Although the informationprovided above is based on careful research and sources that are believed to beaccurate, Nadia Simmons and his associates do not guarantee the accuracy orthoroughness of the data or information reported. The opinions published aboveare neither an offer nor a recommendation to purchase or sell any securities. NadiaSimmons is not a Registered Securities Advisor. By reading Nadia Simmons’reports you fully agree that he will not be held responsible or liable for anydecisions you make regarding any information provided in these reports.Investing, trading and speculation in any financial markets may involve highrisk of loss. Nadia Simmons, Sunshine Profits' employees and affiliates as wellas members of their families may have a short or long position in anysecurities, including those mentioned in any of the reports or essays, and maymake additional purchases and/or sales of those securities without notice.
© 2005-2018 http://www.MarketOracle.co.uk - The Market Oracle is a FREE Daily Financial Markets Analysis & Forecasting online publication.