Crude Oil Sweat, Blood and Tears / Commodities / Crude Oil

 Tradingposition (short-term; our opinion): No positions are justifiedfrom the risk/reward perspective.
OnTuesday, crude oil hit a fresh 2018 high of $64.89, but then reversed anddeclined very quickly, erasing most of Friday increase. What encouraged oilbears to act and how did this decline affect the short-term picture?
Yesterday,the Energy Information Administration said that U.S. oil output is expected tocontinue its rise to 6.55 million barrels per day (with production from shalerising by 111,000 bpd) in the coming month, which encouraged oil bears to act.As a reminder, before the Friday market closure, they received one more reasonto act – the Baker Hughes report, which showed that the oil rig count jumped by10 to 752 (to the highest level since the beginning of September 2017). Whatimpact did the above-mentioned circumstances have on the daily chart of crudeoil?
Technical Picture of Crude Oil
Let’sstart today’s alert with the long-term chart of black gold (charts courtesy of http://stockcharts.com).
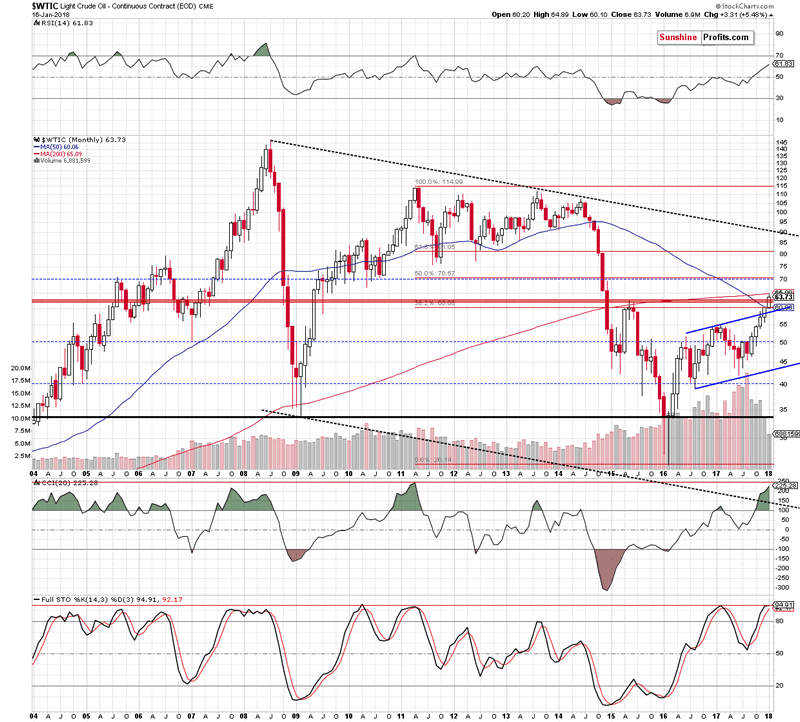
Fromthe long-term perspective, we clearly see that the situation didn’t changemuch. Why? Because black gold is still trading under the 200-month movingaverage,which successfully continues to block the way to higher prices.
DidTuesday fresh high change anything in the shorter perspective?
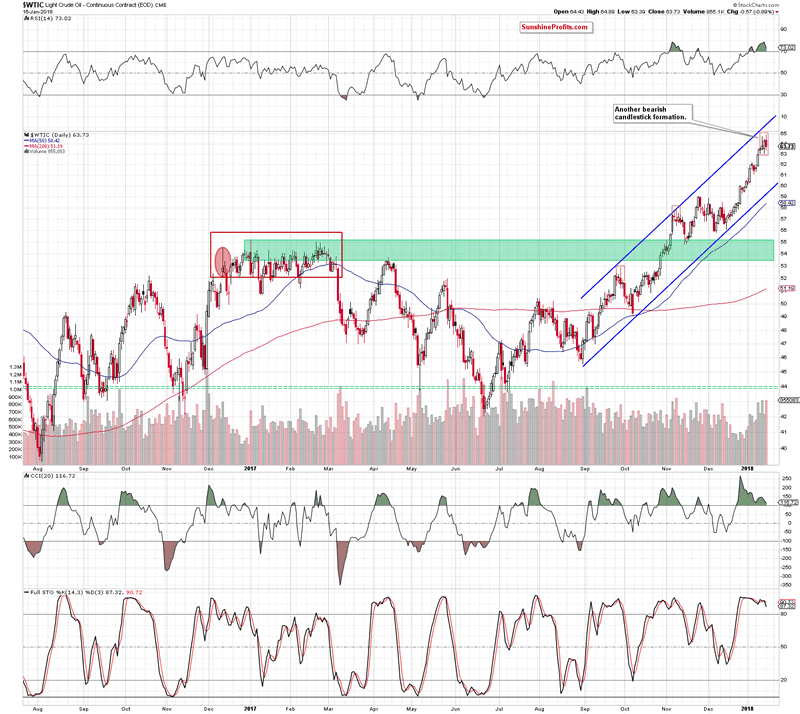
Inour yesterday's alert we wrote that althoughoil bulls did their best, the pro bearish candlestick formation remains in thecards (more about its parameters and its overtones we wrote in our last OilTrading Alert).
Additionally, volume, which accompaniedFriday’s upswing was visibly lower than day earlier, which raises some doubtsabout the continuation of the rally (especially when we factor in the currentposition of the indicators). Nevertheless, we should keep in mind that crudeoil futures hit a fresh 2018 high of $64.89 yesterday.
What does it mean for black gold? Takinginto account the fact that the commodity usually follows futures’ price action,we think that one more upswing and a test of the above-mentioned 200-monthmoving average (currently at $65.09) can’t be ruled out.
Fromtoday’s point of view, we see that oil bulls pushed black oil higher as we hadexpected, but they didn’t even manage to test the 200-month moving average,which showed their weakness.
Additionally,although crude oil climbed to the highest level in 2018, yesterday peak wasonly 12 cents above the last week high. It’s hard to consider this event as aspectacular success - especially when we consider the fact that yesterday “increase”was corrected by oil bears very quickly.
Whatimpact did it have on the technical picture of the commodity? Negative, becausethe sellers created another bearish candlestick formation on the daily chart -dark-cloud cover. What does it mean from a psychological point of view? Simplyspeaking, it illustrates a quite sudden change in mood among investors.
Thefirst part of this formation is dominated by supporters of the current trend.We see a white candle (created on Friday) on the chart, which shows that thebulls don’t have problems with maintaining the direction (at lest at the firstsight). The opening of the second candle continues to confirm the continuationof the trend and the price climbs to a fresh peak. However, what happens nextcauses chaos among investors who have long positions. Why? Because the pricedeclines below half of the body of the white candle, which is usually treatedas a specific barrier to correction. Therefore, when the price drops under thisbarrier investors are afraid of further losses and they are trying to close theirpositions, causing the market to deepen the downward move.
Pleasekeep in mind that the effectiveness of this formation depends on many factors (itis considered as one of the weaker pro-bearish formations), however, when wetake into account other technical details, the probability of reversal andbigger move to the downside increases.
Whatdetails do we mean? Firstly, the shooting star remains in the cards. Secondly, volume, which accompanied yesterdaydecline was significant, which suggests that oil bears can gathering to fight.Thirdly, the proximity to the 200-month moving average continues to support oilbears. Fourthly, there are clearly visible bearishdivergences between all indicators and the price of crude oil. Fifthly, the StochasticOscillator generated the sell signal, while the RSI and the CCI are very closeto doing the same.
Summing up, although crude oil hit a fresh 2018high, the commodity reversed and declined, creating another bearish formationon the daily chart, which together with the current position of the indicatorsand the proximity to important resistance increases the probability of a biggermove to the south in the coming days.
Trading position (short-term; ouropinion): we’re considering opening small shortpositions, but to increase the chance of a profitable positions we will waitfor a confirmation of our assumptions.
If youenjoyed the above analysis and would like to receive free follow-ups, we encourageyou to sign up for our daily newsletter – it’s free and if you don’t like it,you can unsubscribe with just 2 clicks. If you sign up today, you’ll also get 7days of free access to our premium daily Oil Trading Alerts as well as Gold& Silver Trading Alerts. Signup now.
Nadia Simmons
Forex & Oil Trading Strategist
PrzemyslawRadomski
Founder, Editor-in-chief
Sunshine Profits: Gold & Silver, Forex,Bitcoin, Crude Oil & Stocks
Stay updated: sign up for our free mailing listtoday
* * * * *
Disclaimer
All essays, research andinformation found above represent analyses and opinions of Nadia Simmons andSunshine Profits' associates only. As such, it may prove wrong and be a subjectto change without notice. Opinions and analyses were based on data available toauthors of respective essays at the time of writing. Although the informationprovided above is based on careful research and sources that are believed to beaccurate, Nadia Simmons and his associates do not guarantee the accuracy orthoroughness of the data or information reported. The opinions published aboveare neither an offer nor a recommendation to purchase or sell any securities. NadiaSimmons is not a Registered Securities Advisor. By reading Nadia Simmons’reports you fully agree that he will not be held responsible or liable for anydecisions you make regarding any information provided in these reports.Investing, trading and speculation in any financial markets may involve highrisk of loss. Nadia Simmons, Sunshine Profits' employees and affiliates as wellas members of their families may have a short or long position in anysecurities, including those mentioned in any of the reports or essays, and maymake additional purchases and/or sales of those securities without notice.
© 2005-2018 http://www.MarketOracle.co.uk - The Market Oracle is a FREE Daily Financial Markets Analysis & Forecasting online publication.