Expert Says Gold Stock Has Continually Improving Technical Condition
While Dryden Gold Corp. (TSXV:DRY; OTC:DRYGF) is now at a higher price, Technical Analyst Clive Maund still believes the stock is a Strong Buy.
We bought Dryden Gold Corp. (TSXV:DRY; OTC:DRYGF) at a good entry point back in the middle of May, and although it is at a somewhat higher price now, it remains a Strong Buy here for both fundamental and technical reasons.
Before proceeding to review the latest stock charts, we will take a look at the fundamentals with the assistance of the company's new investor deck.
There are three major bullish drivers for Dryden Gold stock:
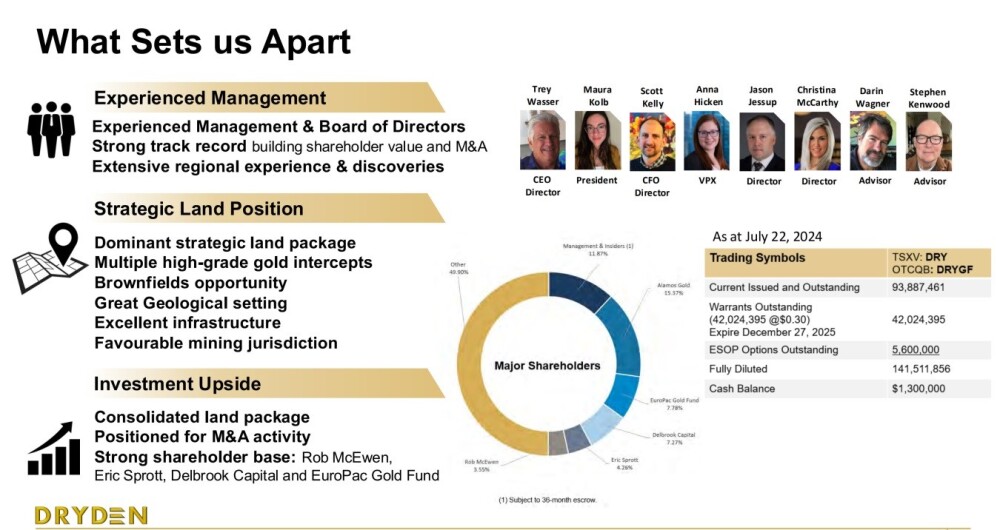
The established bull market in gold itself is set to continue and accelerate, probably dramatically, and with AISC relatively fixed, companies like Dryden will potentially be much more profitable and very attractive to investors.The company owns a most impressive district-scale land package in a favorable jurisdiction with excellent infrastructure, on which it has already delineated very substantial gold reserves.The company is currently engaged in a dynamic and broad-ranging exploration program across its properties that extends into the Fall, in part based on the cost-effective re-logging of the core, which has already yielded very impressive results.The company's major attributes are succinctly set out on the following slide with an important point to note being that the number of shares in issue is a very reasonable 93.8 million, especially given that a little over a half of these are in the possession of big investors and insiders and management, including Alamos Gold, Europac Gold Fund, Eric Sprott and Rob McEwen.
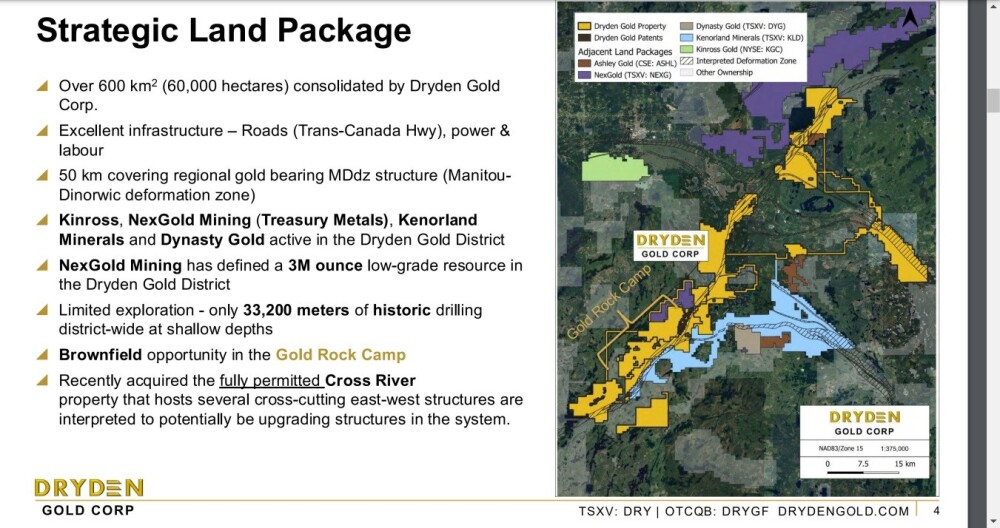
The following slide includes a map showing Dryden's impressive land package and here we should note the proximity of other important mining companies such as Kenorland, Kinross and NexGold who would not be there if the area did not hold big potential so their presence increases the chances of Dryden making big discoveries on its land.
Dryden Gold's properties lie within the prolific Greenstone Belt where many important discoveries have been made.
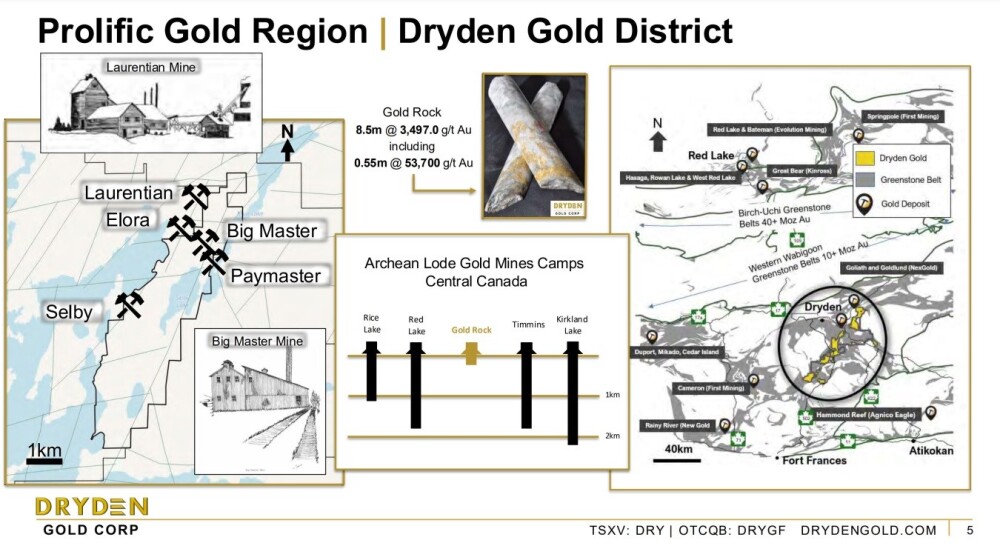
Within the company's properties, the Gold Rock Camp has great potential.

Near surface, high-grade gold has been found across the property.
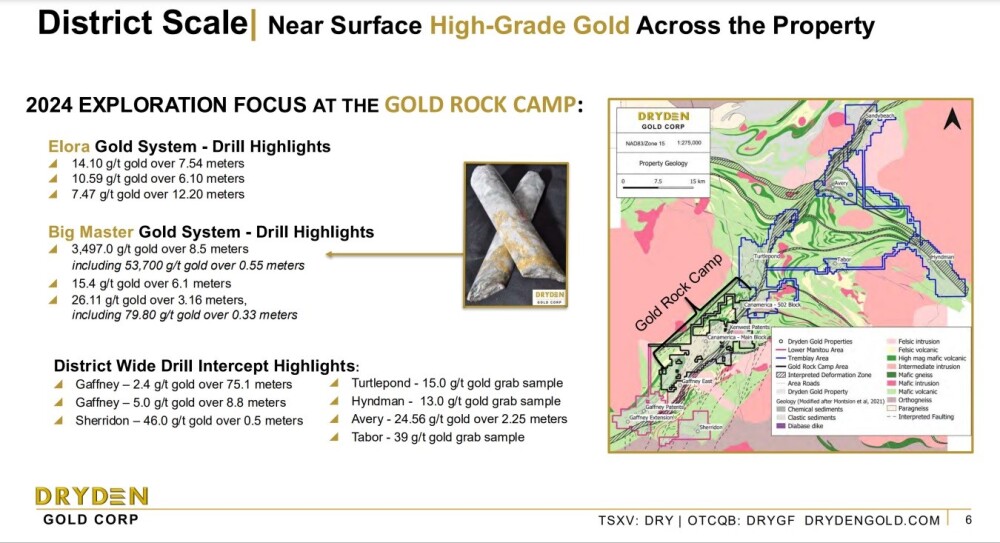
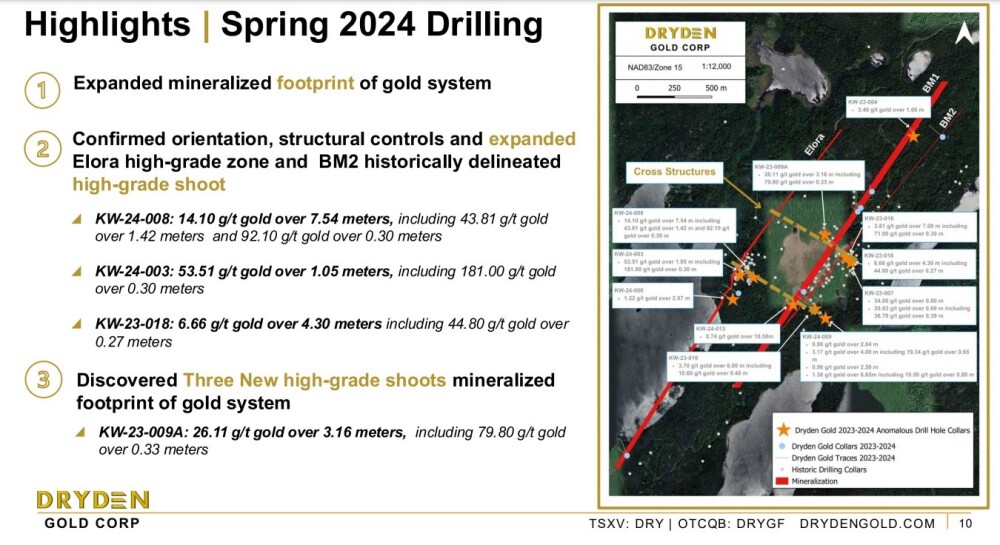
On the next slide, we see highlights of the 2024 drill program.
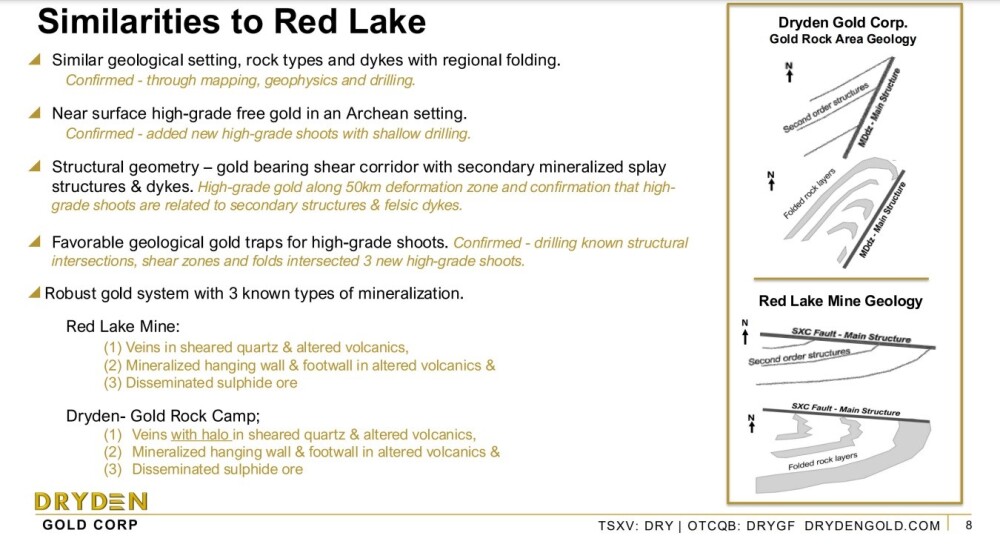
There are strong similarities with the legendary Red Lake, which certainly bodes well.
The re-logging of the existing drill core is a cost-effective way of deepening knowledge of the resource.

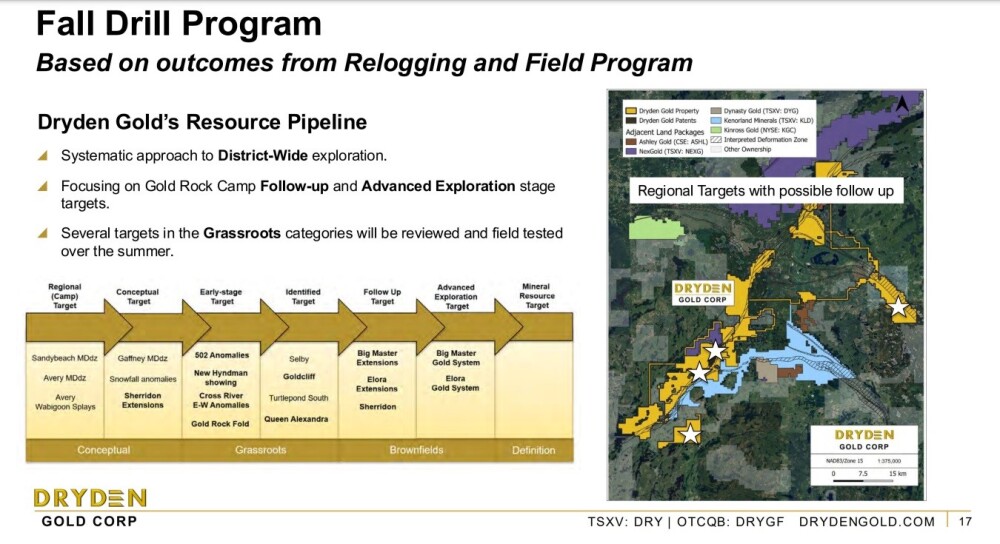
The last slide shows the developmental pipeline and regional drill targets.
The company also recently announced an update on its Phase 5 drill program at its Gold Rock Project. Highlights can be read here.
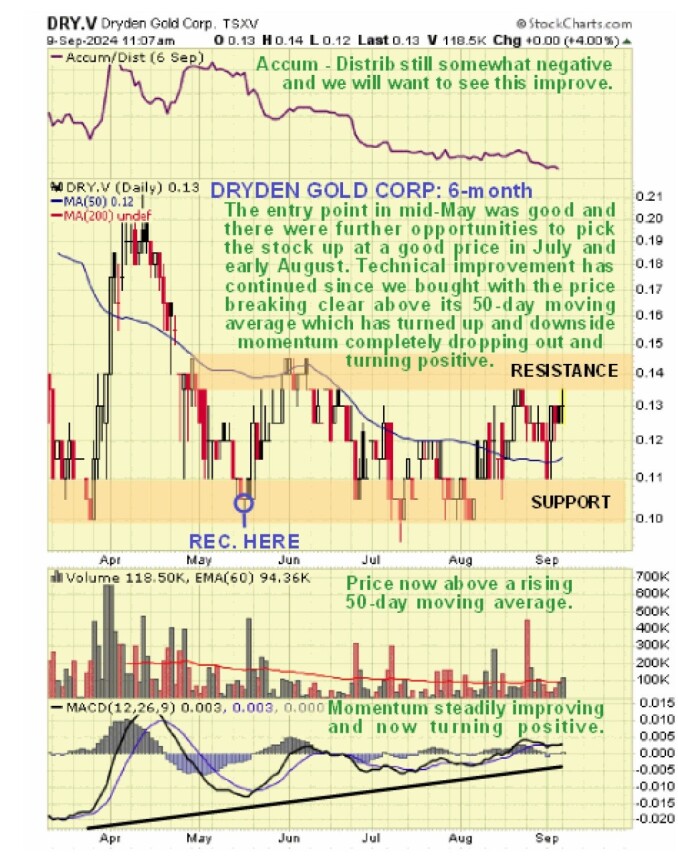
Now, we will review the latest stock charts for Dryden Gold. Starting with the 6-month chart, we can see that it was recommended at a good buy spot at 10.5 cents back in the middle of May, and right after, it rallied up to 14.5 cents.
However, it evidently needed to build out a larger base pattern, so it drifted back down to the support in the 10-cent area in July and early August, presenting further opportunities to buy it at a good price before it started to pick up again in August.
The key point to note here is that, even though it has basically traded sideways in a range for the past several months, its technical condition has steadily improved, as evidenced by the price breaking clear above the 50-day moving average, which has now turned up and by the momentum (MACD) improving to the point that it is now turning positive. Ideally, we would like to see the Accumulation line improve too, and that may happen with the price, especially in the event of its breaking above the resistance that is currently restraining the price.
Zooming out via the 1-year chart enables us to see how the trading range that has formed since late February is a large base pattern that followed the relatively brief but steep bear market that set in soon after it started trading last January.
In the first report, we had thought that the stock might be completing a Double Bottom, but with the dip back to the same support level in July, the pattern can now be classed provisionally as a Triple Bottom, and it may also be a "Cup" with the left side of the possible Cup being the steep drop during the second half of February, but whichever it is, it certainly looks like a convincing base pattern is approaching completion.
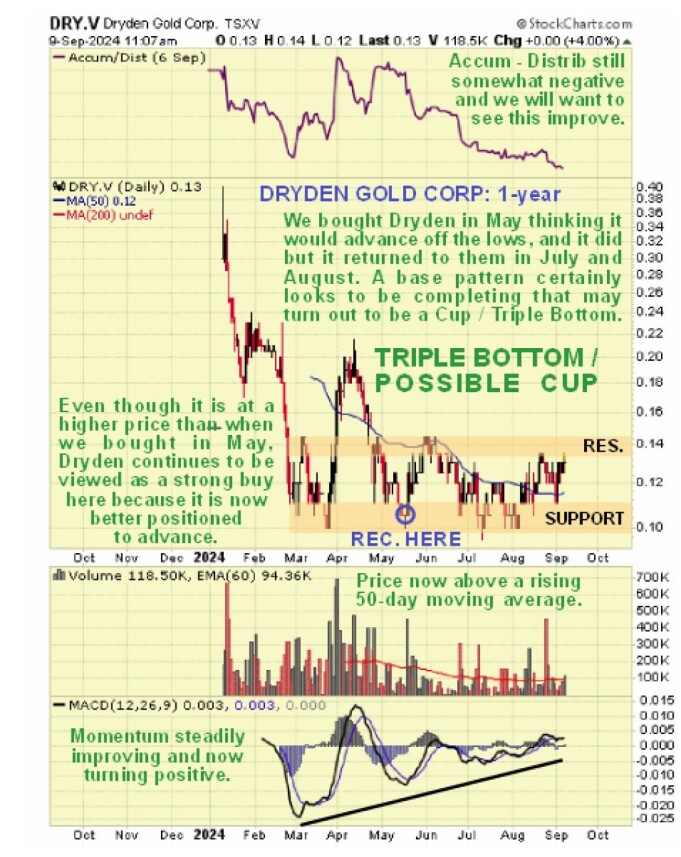
Although Dryden Gold is at a somewhat higher price than when we went for it at a low level in May, it is still rated a Strong Buy here because of the continuing improvement in the technical condition of the stock that is putting it in a better position to mount a sustainable advance soon against the background of the rapidly improving fundamentals of the company.
Dryden Gold's website.
Dryden Gold Corp. (TSXV:DRY; OTC:DRYGF) closed for trading at CA$0.135, US$0.10 on September 9, 2024.
| Want to be the first to know about interestingGold investment ideas?Sign up to receive the FREE Streetwise Reports' newsletter. | Subscribe |
Important Disclosures:
Dryden Gold Corp. is a billboard sponsor of Streetwise Reports and pays SWR a monthly sponsorship fee between US$4,000 and US$5,000.For this article, the Company has paid Street Smart, an affiliate of Streetwise Reports, US$1,500.As of the date of this article, officers and/or employees of Streetwise Reports LLC (including members of their household) own securities of Dryden Gold Corp. Author Certification and Compensation: [Clive Maund of clivemaund.com] was retained and compensated as an independent contractor by Street Smart to write this article. Mr. Maund is a technical analyst who analyzes historical trading data and he received his UK Technical Analysts' Diploma in 1989. The recommendations and opinions expressed in this content reflect the personal, independent, and objective views of the author regarding any and all of the companies discussed. No part of the compensation received by the author was, is, or will be directly or indirectly tied to the specific recommendations or views expressed.Statements and opinions expressed are the opinions of the author and not of Streetwise Reports, Street Smart, or their officers. The author is wholly responsible for the accuracy of the statements. Streetwise Reports requires contributing authors to disclose any shareholdings in, or economic relationships with, companies that they write about. Any disclosures from the author can be found below. Streetwise Reports relies upon the authors to accurately provide this information and Streetwise Reports has no means of verifying its accuracy.This article does not constitute investment advice and is not a solicitation for any investment. Streetwise Reports does not render general or specific investment advice and the information on Streetwise Reports should not be considered a recommendation to buy or sell any security. Each reader is encouraged to consult with his or her personal financial adviser and perform their own comprehensive investment research. By opening this page, each reader accepts and agrees to Streetwise Reports' terms of use and full legal disclaimer. Streetwise Reports does not endorse or recommend the business, products, services, or securities of any company.For additional disclosures, please click here.
Clivemaund.com Disclosures
The above represents the opinion and analysis of Mr. Maund, based on data available to him, at the time of writing. Mr. Maund's opinions are his own, and are not a recommendation or an offer to buy or sell securities. As trading and investing in any financial markets may involve serious risk of loss, Mr. Maund recommends that you consult with a qualified investment advisor, one licensed by appropriate regulatory agencies in your legal jurisdiction, and do your own due diligence and research when making any kind of a transaction with financial ramifications. Although a qualified and experienced stock market analyst, Clive Maund is not a Registered Securities Advisor. Therefore Mr. Maund's opinions on the market and stocks cannot be construed as a recommendation or solicitation to buy and sell securities.
