Gold's Psychological Litmus Test
Gold still under pressure from dollar strength, Treasury yield spike.
All-important test of the 200-day MA will determine its immediate fate.
Relative strength factor still lacking for gold, however.
With the dust not yet having settled from the recent rally failure of the gold price, the yellow metal has returned to a position all too familiar with gold bulls. The bulls are now searching for a catalyst that would encourage flight-to-quality demand for gold among uncommitted investors. While there is no shortage of "fear factors" which could stimulate gold buying interest, the main thing hampering a gold rebound is the persistent strength in the U.S. dollar. In today's commentary we'll look at an upcoming window of opportunity for gold to rebound which is predicated on a short-term peak of the dollar's rally.
Aside from gold's continued headwinds from the dollar's strength, gold is now facing an important test of its trading range floor. The upper boundary of this range was first established on Jan. 25 after the gold price hit its peak for the year at $1,368. Since then the gold price has fluctuated within the confines of a trading range which is roughly $60 when measured from top to bottom. One of the best ways of illustrating the parameters of this range is by looking at the chart of the iShares Gold Trust (IAU), which has a more clearly delineated range than the actual gold price.
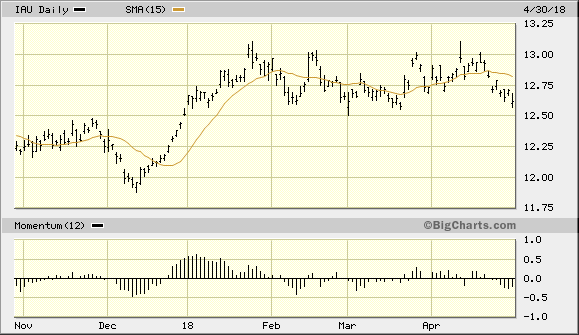
Source: BigCharts
Not only have gold and the gold ETF trended sideways since late January, but the 52-week range for gold is the narrowest since 2005, according to Mike McGlone of Bloomberg Intelligence. McGlone attributes the narrowing gold price in recent months to a strengthening dollar, which in turn is a consequence of rising Treasury yields. On this point I agree with McGlone's assessment of the gold market. What is needed to break gold out of its trading range, however, is a substantial pullback in the U.S. Dollar Index (DXY) which we'll examine here.
A short-term peak in the dollar index would almost certainly put a halt to the latest slide in the gold price. Shown here is the DXY in relation to its immediate-term 15-day moving average and its dominant longer-term 200-day moving average. The latter is a tool which is widely followed by both retail and institutional investors and as such carries a psychological significance. DXY is now testing its 200-day MA as its latest rally has reached the 92.00 level (below). Any time the dollar index has fallen below 200-day MA then rallies above it, the dollar has tended to continue moving higher in the near term. A decisive breakout above the 200-day MA, especially when the dollar has remained below it for almost a year, is bound to have a profound impact on trader sentiment. Thus, gold's near-term outlook hangs in the balance of the dollar's latest test of its 200-day trend line.
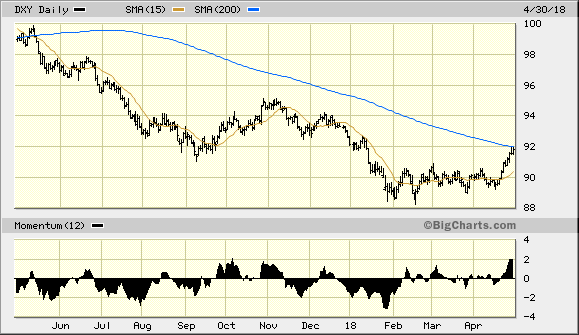
Source: BigCharts
A reversal of the rally in the dollar index at the 200-day MA this week, however, would give the gold bulls a definite advantage. In fact a pullback of the DXY in the next couple of days would almost certainly encourage a gold rally, especially now that its trading range floor is about to be tested. There is some evidence that the dollar index is technically "overbought" and the 12-day momentum indicator shown in the above DXY chart attests to this. This gives the gold bulls a slight edge in their attempts at reversing the gold price above the 200-day moving average as shown in the June gold futures graph, below.
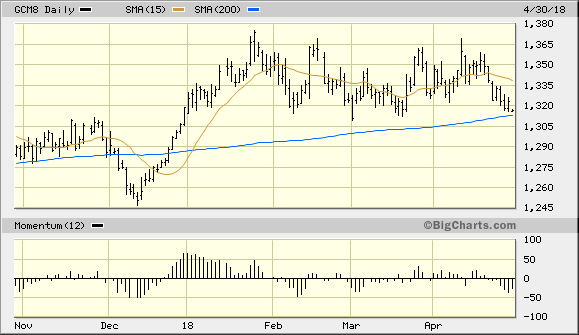
Source: BigCharts
The only thing missing which would all but assure gold of a rebound in the coming days is the relative strength factor. I'm referring to gold's relative price strength versus that of the S&P 500 Index (SPX), which to date has been unexceptional. A rising relative strength line for gold is a strong indication that gold's upside potential is increased since it reflects institutional interest in the metal. There is room for improvement on this score, as can be seen in the relative strength graph shown here.
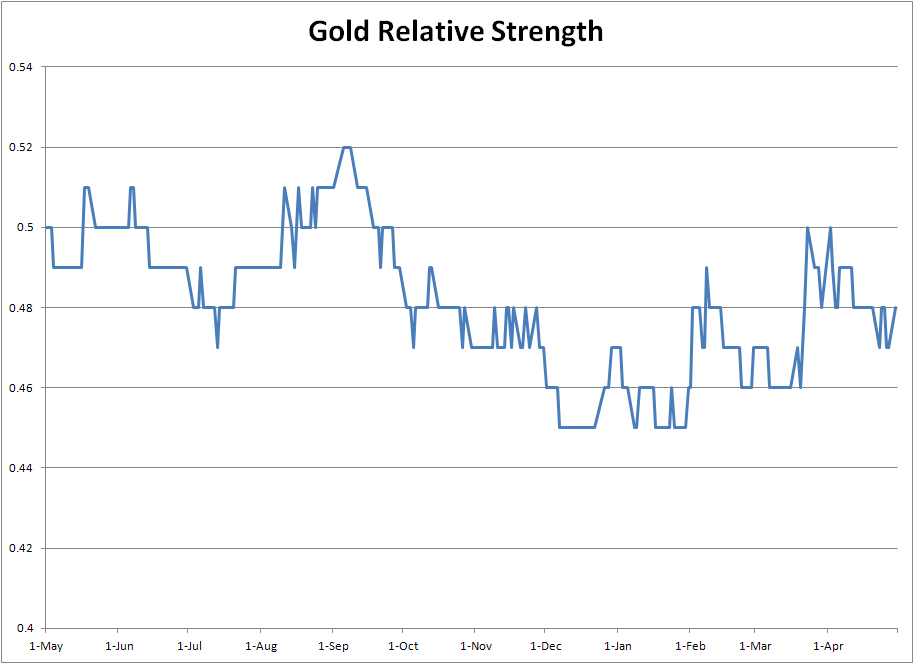
Source: WSJ
Speaking of relative strength, another area which should ideally show leadership for the gold price as the bulls attempt to regain control is silver. As previously discussed, the silver price typically serves as a leading indicator for the gold price. Certainly at an important juncture we want to see silver at least confirming a gold rally; even better is when silver leads gold by moving higher after a notable decline. Shown here is the daily graph for the iShares Silver Trust ETF (SLV). As you can see, SLV remains below both its 5-day ant 15-day moving averages as of Monday. This means we can assume that a bottoming attempt hasn't even been made yet for SLV. The silver ETF, like the gold ETF, first needs a simple 2-day close above its 5-day moving average in order to break the first line of overhead supply. This in turn would allow the bulls to begin a bottoming process.
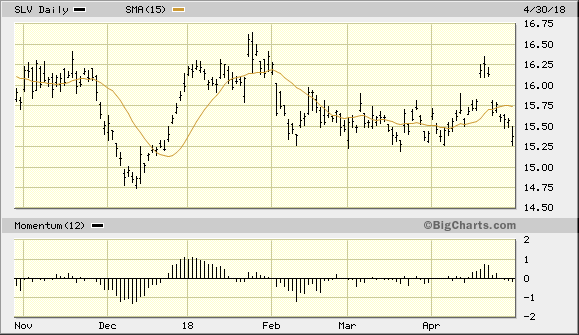
Source: BigCharts
Until then, I continue to recommend that short-term traders remain in cash after the latest weakness in the gold price. We exited a conservative trading position in the iShares Gold Trust (IAU), below, on Apr. 23 after our technical trading discipline confirmed an exit signal. IAU remains below its 15-day moving average but is still above the $12.50 level - the lower boundary of a 3-month trading range. Until IAU confirms a renewed immediate-term (1-4 week) buy signal, traders should keep their powder dry for now. A 2-day higher close above the 15-day MA is needed for the gold ETF to confirm a bottom, along with a reversal of the dollar's immediate-term uptrend.
Disclosure: I/we have no positions in any stocks mentioned, and no plans to initiate any positions within the next 72 hours.
I wrote this article myself, and it expresses my own opinions. I am not receiving compensation for it (other than from Seeking Alpha). I have no business relationship with any company whose stock is mentioned in this article.
Follow Clif Droke and get email alerts