Gold: An Introduction And Update On The Midas Touch Gold Model
Gold is the most emotional asset class.
What exactly does the Midas Touch Gold model entail?
The model has been neutral since February.
Ascending triangle should take gold towards $1,500.
Silver might celebrate a strong comeback.

Final pullback before the summer rally has started
We have been very patient over the last couple of months regarding gold. Now it looks as our main scenario with a pullback below $1,300 is coming into reality. Gold will likely shake out all the weak hands who bought into the tricky sideways consolidation since end of January. We believe this will lay the foundation for a spectacular rally in gold and silver starting this summer.
Gold, likely the most emotional asset in the world
Generally speaking, regarding gold opinions and perceptions are strongly divided. While on the one hand many gold bugs suspect a conspiracy theory behind each pullback in price and expect the direct demise of the Western World, the mainstream and society in general on the other hand deny the numerous strengths that gold investments certainly have and continue to call it a "barbaric relic of a bygone era." The truth lies, as so often, somewhere in the middle of these two opposed views.
Yet gold is an extremely emotional subject and human fascination with gold is as old as recorded history. Therefore, it is no wonder, that the belief in gold is psychologically deeply rooted in our subconsciousness as it has been conditioned for over five thousand years. But at the same time and from a rational perspective, it is only a rare metal whose price is defined in an almost 24-hour trading day by the worldwide financial markets.
Barring this, in times of an unprecedented expansion of worldwide fiat money supply and unseen negative interest rates, an investor cannot afford to ignore the asset class "precious metals." After all, mankind's history is full of currency collapses and disasters, yet gold has survived them all. However, one should not be guided by emotions, but act based on a method that gives clear and simple signals. Moreover only with a strict and disciplined contrarian approach one will be able to profit from gold's never-ending price fluctuations.
A rational yet holistic approach to analyze gold
Based on more than 17 years of experience in the gold market, we have developed our Midas Touch Gold Model. This model represents a holistic approach towards the gold market and collects data points from technical, sentimental and fundamental perspectives that can all be quantified and measured with back-tested formulas. Although the model is based on a great variety of underlying data, it is suitable for drawing up a comprehensive, compact and lucid analysis in a relatively short matter of time.
What exactly does the model entail?
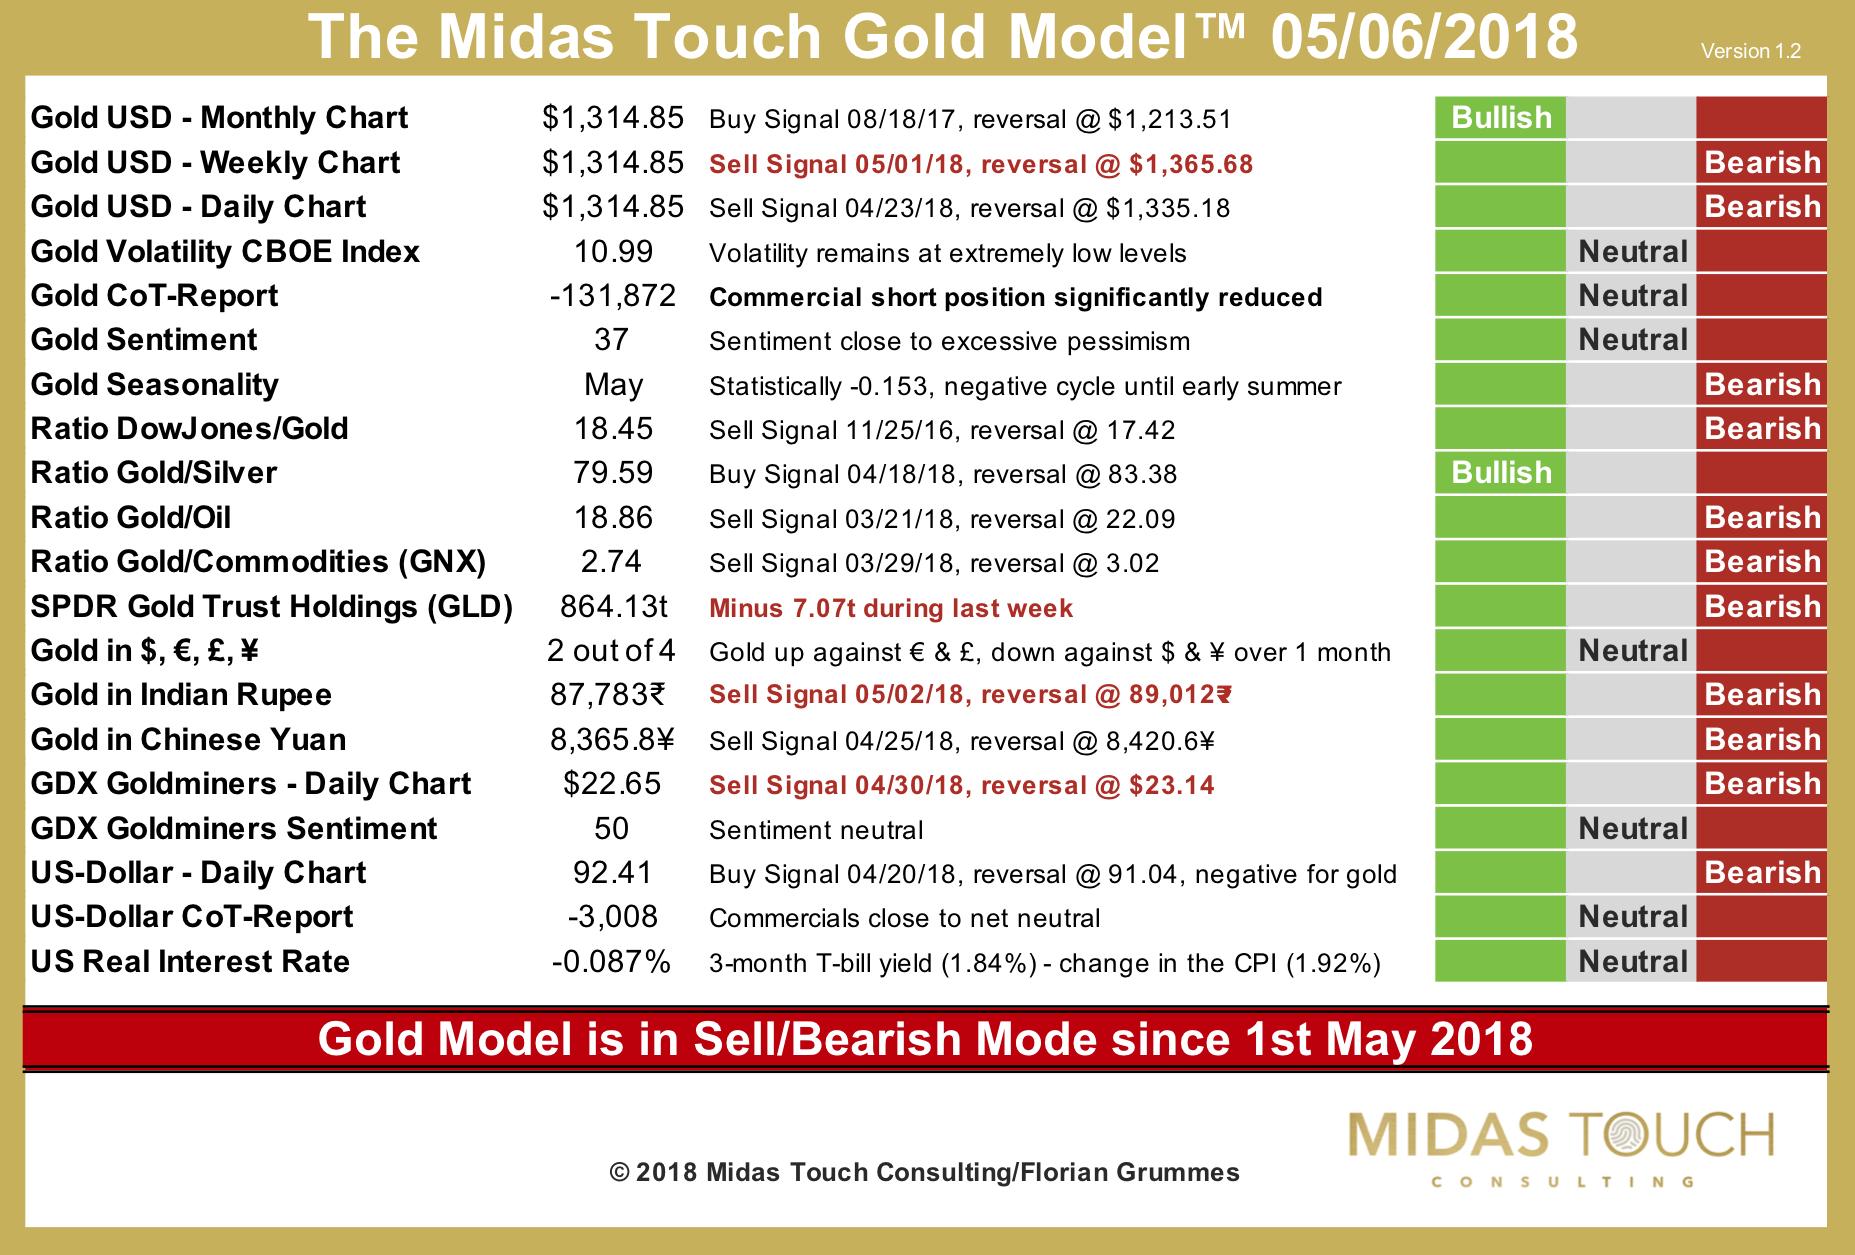 The first component, a trend following indicator based on the monthly chart has given a buy signal in mid of August 2017. With trend following indicators based on weekly and daily charts, the model zooms in on shorter-term trends. Since 1st of May, the weekly chart has turned bearish and makes already clear that gold will likely need more time, before it will be able to break through the strong horizontal resistance zone around $1,350 to $1,375.
Next the model analyzes volatility. Rising volatility primarily occurs in downtrends, while upward trends are most of the time associated with relatively low volatility. The underlying formula mainly focuses on the prevailing price trend and the rising or falling volatility accompanying it. Currently volatility is extremely low and suggests that speculative interest in precious metals is very low.
Very important contrarian signals
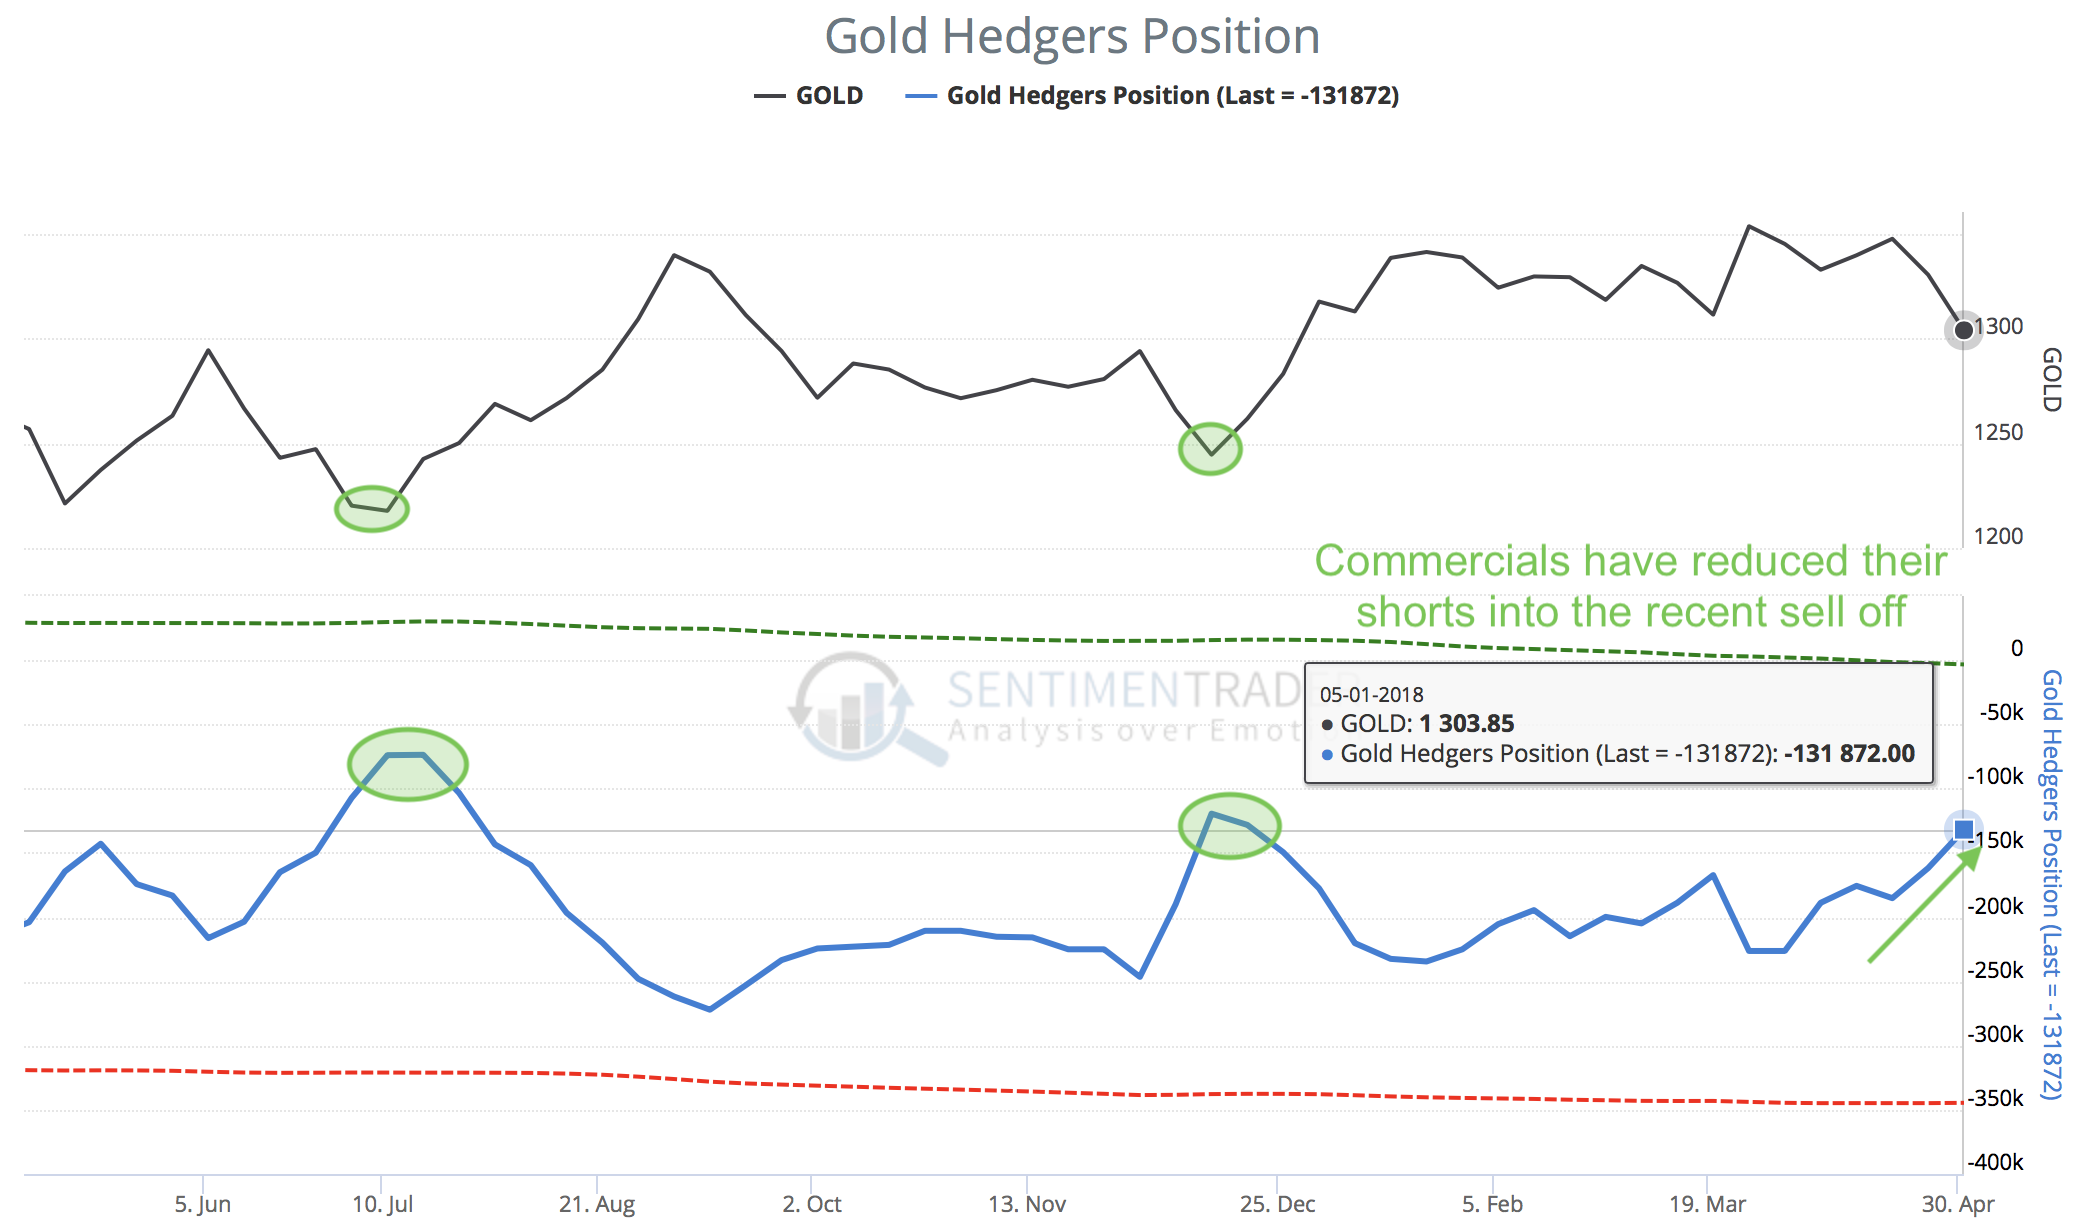
Commitment of Trade reports (CoT) and sentiment data of course are two well-known contrarian counter-cyclical signals that are integrated in the model as well. Commercial hedgers recently have started to cover their large short position. With a cumulated short position of currently 131,872, the CoT-report contributes a neutral reading. At the same time pessimism predominates slightly in the gold market yet there is certainly no panic present. The best entry opportunities usually occur in an extremely pessimistic or panicked environment.
Ratios and changes in ETF bullion holdings
Next a number of ratios are integrated in the model. Apart from the classical Dow/gold ratio, which continues to be bullish for stocks and therefore bearish for gold, the gold/silver ratio finally seems to have topped and might now lead the whole sector into better times. The model also includes the gold/oil ratio as well as the ratio of gold vs. other commodities.
When gold clearly outperforms other commodities, it is likely driven by safe haven demand. On these occasions, very steep, irrational price spikes can often be observed. The model moreover analyses changes in the bullion holdings of the largest and most important gold ETF, the SPDR gold shares (NYSEARCA:GLD), on a weekly basis as a proxy for investment demand.
Multipolar Gold World
In addition, the model includes two trend-following signals tied to the gold price trend in terms of the Chinese yuan and the Indian rupee. Together China and India now represent more than 50% of global physical gold demand. Gold mining shares are naturally part of the model as well. A trend following signal based on the daily price chart of the gold mining ETF GDX as well as the associated sentiment is used for this purpose. Gold stocks often tend to lead the gold price (currently they start to show strength against gold). Lastly, the model tracks the performance of the US dollar and its CoT-data as well as the trend in US real interest rates.
The model has been neutral since February
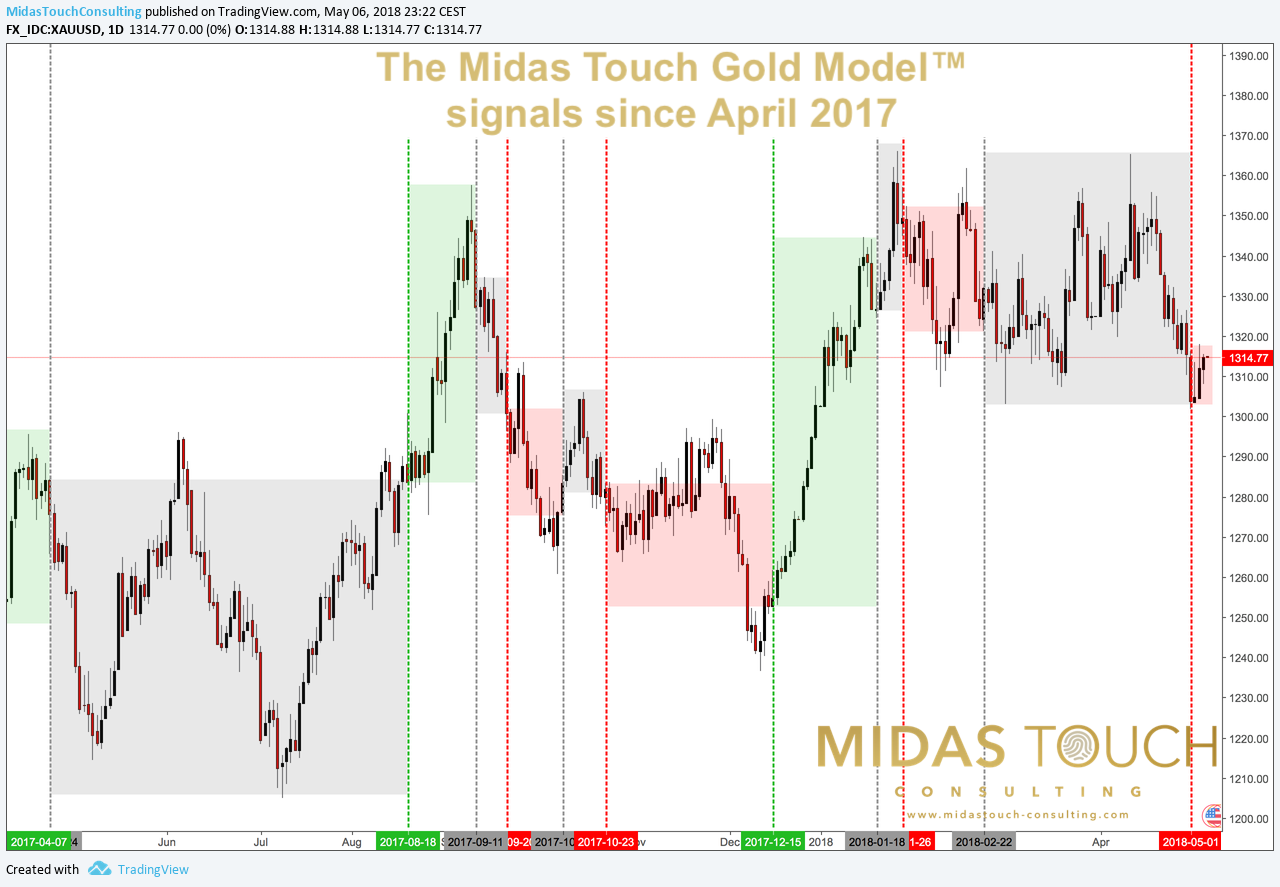 All in all, the Model has served as an excellent guideline to date. Over the last three months, for example, the model has remained in neutral mode and helped to avoid the tricky and confusing sideways consolidation in which the gold market has been caught since end of January 2018.
Now with the start of the typically weak seasonal cycle in spring, the model finally has turned bearish pointing to a breakdown below $1,300. Although being pretty oversold the model's conclusion on gold's immediate fate seems to be clear. We expect the final low to come in between $1,250 and $1,280 over the next one to three months and recommend being patient for now.
Ascending triangle should take gold towards $1,500
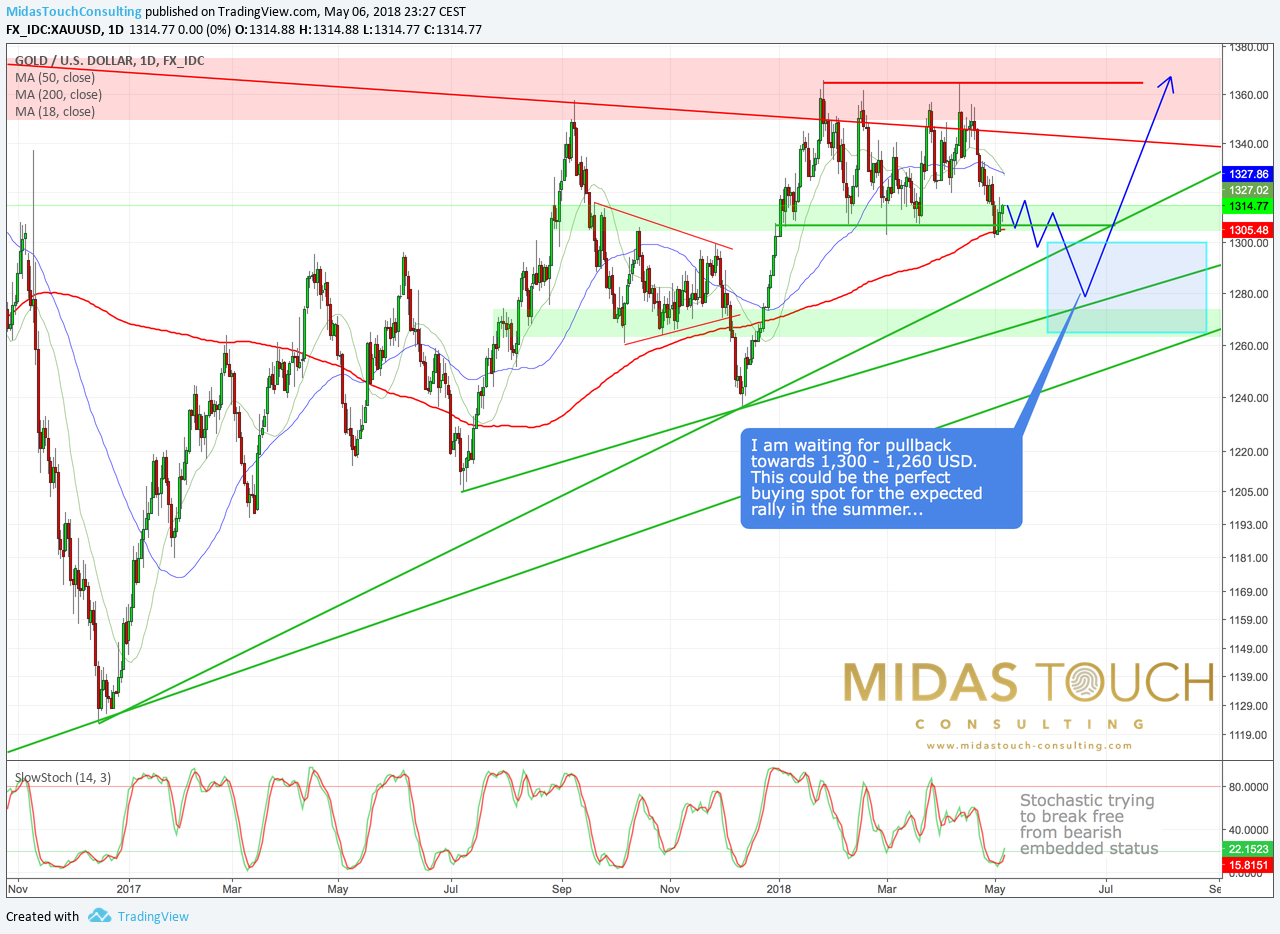 In the bigger picture, gold is moving within an ascending and therefore bullish triangle. It will likely test the rising support line and then turn back up again. With such a pullback all the weak hands should be shaken out. This would create the perfect setup for another attack towards $1,350-1,375 somewhere during this summer.
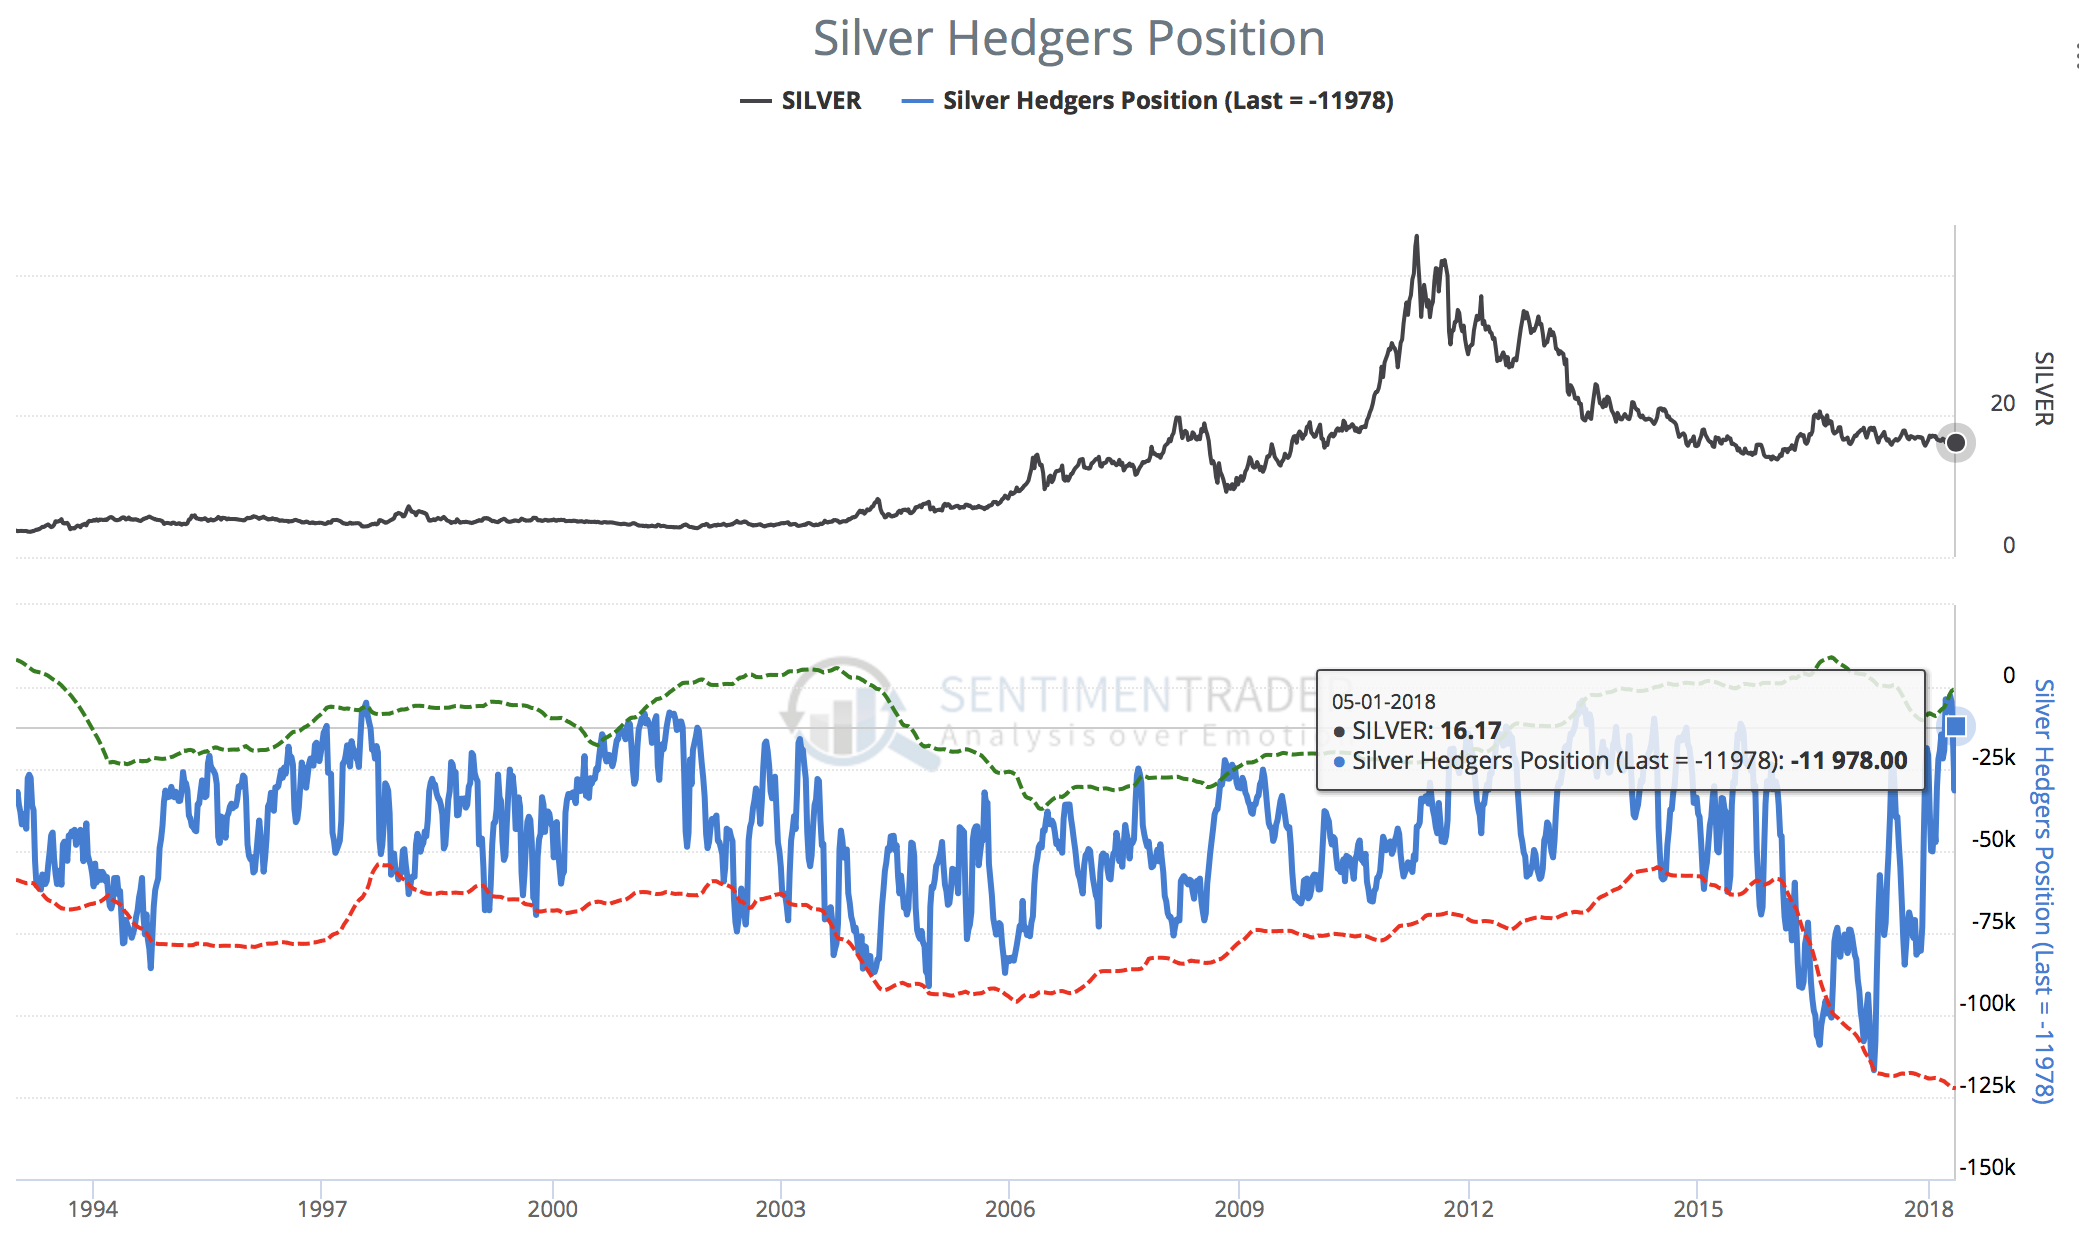 Regarding silver we identified a very promising setup in the CoT-data as commercial players have reduced their short position to extremely low levels. At the same time, large speculators are now net short the metal. This is a very rare and very bullish constellation. As well, sentiment and general speculation in silver are beaten down. In combination with the gold/silver ratio, which seems to have to turned back down from extreme levels above 80, the inflation-sensitive precious metal silver looks very promising and might celebrate a comeback in the second half of the year. Especially in the case that concerns regarding inflation should pick up.
As for the second half of this year, gold and especially silver should therefore see at least a strong summer rally, which could even turn into a strong breakout rally towards $1,500 in gold and $26 in silver.
To conclude, we are very sure that investors and traders will benefit from our Midas Touch Gold Model and its rational approach in the unfolding and always exciting gold and precious metals markets. Even if the model's conclusion might not always be right, the fact alone that one can save himself a lot of time by just going through all important perspectives in one regularly updated model is unique and very helpful.
Disclosure: I am/we are long PHYSICAL GOLD AND SILVER.
I wrote this article myself, and it expresses my own opinions. I am not receiving compensation for it. I have no business relationship with any company whose stock is mentioned in this article.
Follow Florian Grummes and get email alerts