Gold and Crypto: Is This How Charts Look Before A Monetary Collapse? / Commodities / Gold & Silver 2020

It is the the massive debt. It cannot beserviced. It will collapse the whole system.
The gold, silver and cryptocurrencies chartsare showing signs of going parabolic. The US dollar is close to confirming a massive breakdown.
Gold, silver and cryptocurrencies allprovide “crisis value” by simply being an acceptable debt-based fiatalternative. It is only later in this crisis that we will see a divergencebetween cryptocurrency and precious metals.
For now, they are likely to move highertogether.
Gold has recently made new all-time highs,and seems ready to go higher after a decent consolidation. The importance ofthe 2011 all-time high can be seen on these charts:
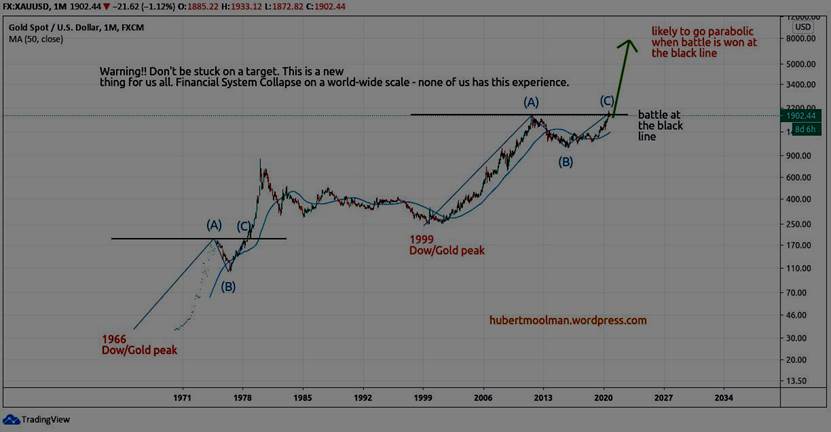
I have marked two fractals (ABC). Bothfractals start from the Dow/Gold ratio peaks (1966 and 1999). For these tocontinue the similarity, the level ($1920) at A and C needs to be surpassed onthe current fractal.
We’ve already seen the breakout, now pricehas just been consolidating around that level. It is very close to blastinghigher.
From a cycle analysis point of view, we areright at a point where a sustained multi-year gold rally is possible:
The top chart is goldfrom about 1997 to 2020 (current fractal), and the bottom chart is gold fromabout 1965 to 1980 (70s fractals). If the current fractal continues to followthe 70s fractal, then we could see gold continue to multiples of its currentall-time high.
Currently, we are justafter, or close to, a major Dow peak in the economic cycle. Again, you can seethat the 2011 peak is an importantindicator to confirm these fractals as relevant. It could also be considered amarker after which the chart is likely to go parabolic.
Bitcoin has been quiet,but could be ready to move higher at a frightening pace. Here is an updatedchart that I shared on my blog previously:
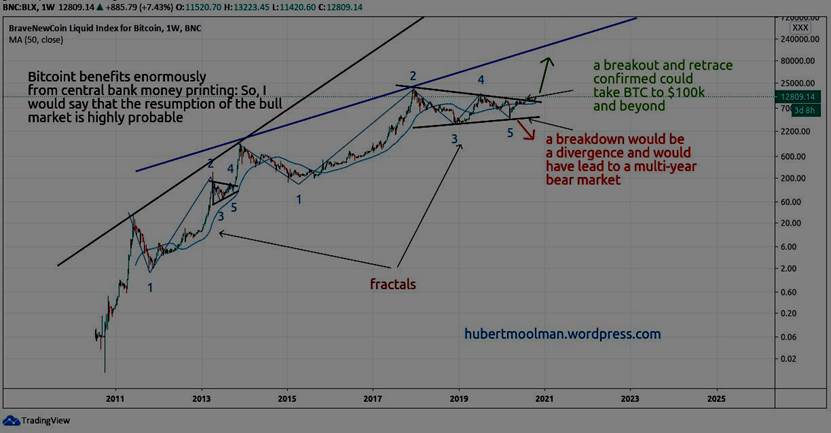
The setup for Bitcoin isvery similar to the end of 2013, based on these fractals. Price has completed asuccessful breakout at the wedge, and the retrace is also done.
We are likely in a movetowards the $100 000 level at least.
The outlook for silver is really the same: continue on its parabolic path.
For more on this, andsimilar analysis you are welcome to subscribe to my premium service. Ihave also recently completed a Silver Fractal Analysis Report as well as a Gold Fractal Analysis Report.
Warm regards,
Hubert
“And it shall come to pass, that whosoevershall call on the name of the Lord shall be saved”
http://hubertmoolman.wordpress.com/
You can email any comments to hubert@hgmandassociates.co.za
© 2020 Copyright Hubert Moolman - All Rights Reserved
Disclaimer: The above is a matter of opinion provided for general information purposes only and is not intended as investment advice. Information and analysis above are derived from sources and utilising methods believed to be reliable, but we cannot accept responsibility for any losses you may incur as a result of this analysis. Individuals should consult with their personal financial advisors.
© 2005-2019 http://www.MarketOracle.co.uk - The Market Oracle is a FREE Daily Financial Markets Analysis & Forecasting online publication.