Gold And Silver Follow Up & Future Predictions For 2020 & 2021 - Part II / Commodities / Gold & Silver 2020

This second part of our research post on super-cycles and precious metals will present our expectations going forward for 6 to 24+ months. In Part I of this research post, I linked a number of our previous research articles we recommended to readers to review for context and continuity. If you have not read Part I of this research article, please take a minute to review that first segment before you continue reading this second segment of our research.
TECHNICAL CYCLES & MORE
There is a technical cycle that is taking place as stocks and Gold appreciate. In the first phase, there is a basing process in both the stock market and Gold (sometimes not happening at the same time). From this basing level, the stock market begins to rally and Gold begins to appreciate as well.
In the second phase, the stock market rallies to a peak which prompts some degree of selling. This selling spills over into Gold and Silver; panic selling usually spills over to Gold and Silver immediately, putting price pressure on these precious metals. In other words, when broad market selling takes place, Gold and Silver are not immune from this panic type of downside price event and suffer accordingly. However, they react differently weeks and months after this type of price correction.
In the final phase, which usually takes place after a deep correction in the US stock market and after some new low price base has set up, the real appreciation for precious metals typically happens in a parabolic price trend. This is when risks are still perceived to be moderately high throughout the globe, yet the stock market continues to attempt to base/drive higher while Gold and Silver begin a real sharp upside price trend.
Pay attention to how the BASE LEVELS on the following Smart Cash Index to Gold Monthly chart are followed by periods of price appreciation in both the stock market and Gold. Notice how Gold has rallied in nearly equal (100% Measured Moves) since 2002 – first rallying nearly $750 (2008), then rallying nearly $950 (2011), and recently rallying nearly $950 (2020). This suggests any continuation of the 100% Measured Move structure would place a new target for Gold near $2,900~3,000. We believe a new parabolic price trend is setting up after the deep double-bottom BASE LEVEL between 2016~2020.
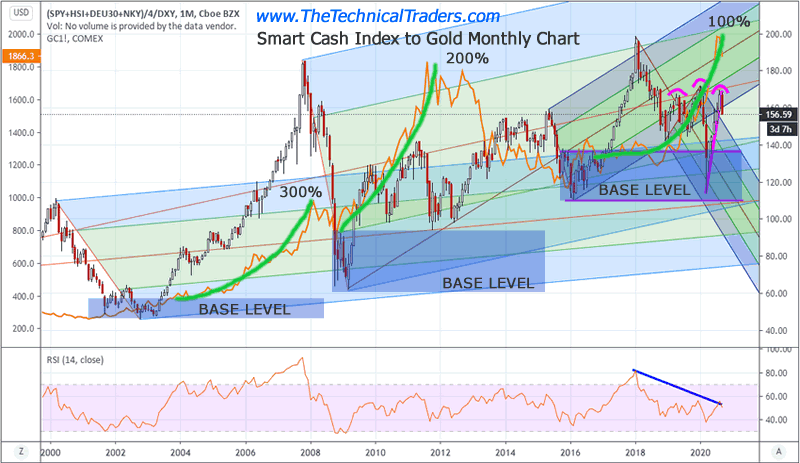
If our research is correct, the Super-Cycles and the deep rotation BASE LEVELS will likely set up a new base level near $1,800 to $1,950 in Gold and near $145 to $175 on our Smart Cash Index chart (see the chart further below). We believe this new base level will act as a launchpad for the new parabolic price trend in Gold and Silver throughout 2022~2023 – possibly longer.
Before you continue, be sure to opt-in to our free-market trend signalsnow so you don’t miss our next special report!
Looking deeper, if you take a technical glance at the Custom Smart Cash Index chart below and consider how gold has advanced over the past 20 years, you’ll see the nearly 100% Measured Moves taking place (which have resulted in a 300%, 200%, 100% series of advances). Yet, what you have also seen is a moderate market peak in 2000 followed by an extensive upside price rally peaking in 2007. From that peak in 2007, we see a deep price decline and a series of sideways price trends leading up to the 2015~2016 US Presidential Election event.
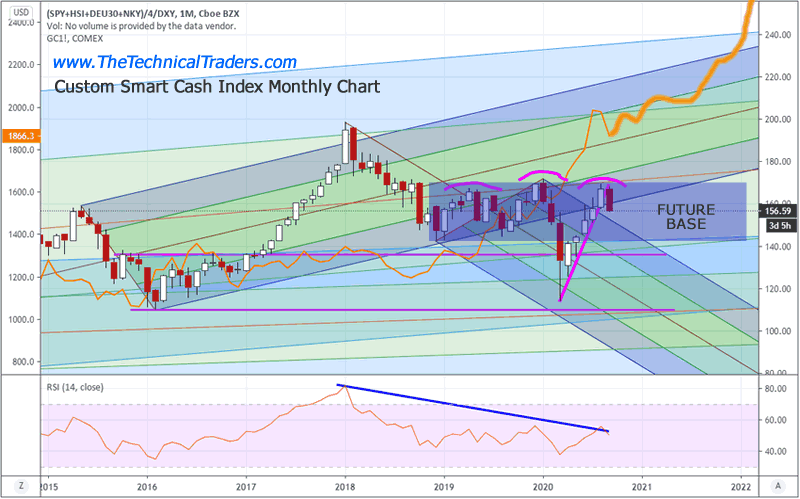
After that, we see a strong upside price rally that peaked in early 2018 (which we are calling the Ultimate Top in the US stock market). This setup has a very telling pattern in price – not quite a Double-Top but rather a failed “Scouting Party” pattern where price attempted to rally above the previous 2007 peak and failed.
Currently, we believe the FUTURE BASE will set up near the current Head-and-Shoulders pattern on the Smart Cash Index or just above the previous BASE LEVEL. There is a risk of a deeper downside price move in the Smart Cash Index which may set up a deeper price base, but we have no indication at this time that any immediate, deeper downside price move is about to unload on the global markets. We believe the next 4+ years will be very similar to the 2009~2011 setup – where the US stock market attempt so establish moderate sideways/upside price base and where Gold settles above $1,800 and starts another measure move or transitions into a parabolic upside move higher.
The question our researchers continue to ask is “will the FUTURE BASE confirm and will Gold stay above $1800 to setup the new launch pad for the parabolic upside price trend?”. We’ve clearly entered a different phase of the market – likely nearing the end of the “Excess Phase”. Obviously, a deep downside price move in the US stock market is not something we want to see happen because it could create far more critical events in the future. Yet, we believe the current BASE LEVEL and the FUTURE BASE level are ideal support zones for the US stock market and the new launch pad for precious metals.
If our research is correct, by November, December or January, we should clearly know where the new BASE LEVEL has formed and if any deeper downside risks present any greater concerns. The longer-term, our Super Cycles analysis suggests we are in for a wild ride – you certainly don’t want to miss this big move in metals.
This market, the future setups described above, and the profits lying therein are fantastic opportunities for skilled technical traders to capitalize on. Isn’t it time you learned how I can help you find and execute better trades? My incredible technical analysis team and our proprietary tools have just shown you what to expect 6+ months into the future. Do you want to learn how to profit from these huge moves? Sign up for my Active ETF Swing Trade Signals today! If you have a buy-and-hold account and are looking for long-term technical signals for when to buy and sell equities, bonds, or cash, be sure to subscribe to my Passive Long-Term ETF Investing Signals.
Stay healthy and rest easy at night by staying informed of market trends with The Technical Traders!
Chris Vermeulen
www.TheTechnicalTraders.com
Chris Vermeulen has been involvedin the markets since 1997 and is the founder of Technical Traders Ltd. He is an internationally recognized technical analyst, trader,and is the author of the book: 7 Steps to Win With Logic
Through years ofresearch, trading and helping individual traders around the world. He learnedthat many traders have great trading ideas, but they lack one thing, theystruggle to execute trades in a systematic way for consistent results. Chrishelps educate traders with a three-hourvideo course that can change your trading results for the better.
His mission is to help hisclients boost their trading performance while reducing market exposure andportfolio volatility.
He is a regularspeaker on HoweStreet.com, and the FinancialSurvivorNetwork radio shows. Chriswas also featured on the cover of AmalgaTrader Magazine, and contributesarticles to several leading financial hubs like MarketOracle.co.uk
Disclaimer: Nothing in this report should be construed as a solicitation to buy or sell any securities mentioned. Technical Traders Ltd., its owners and the author of this report are not registered broker-dealers or financial advisors. Before investing in any securities, you should consult with your financial advisor and a registered broker-dealer. Never make an investment based solely on what you read in an online or printed report, including this report, especially if the investment involves a small, thinly-traded company that isn’t well known. Technical Traders Ltd. and the author of this report has been paid by Cardiff Energy Corp. In addition, the author owns shares of Cardiff Energy Corp. and would also benefit from volume and price appreciation of its stock. The information provided here within should not be construed as a financial analysis but rather as an advertisement. The author’s views and opinions regarding the companies featured in reports are his own views and are based on information that he has researched independently and has received, which the author assumes to be reliable. Technical Traders Ltd. and the author of this report do not guarantee the accuracy, completeness, or usefulness of any content of this report, nor its fitness for any particular purpose. Lastly, the author does not guarantee that any of the companies mentioned in the reports will perform as expected, and any comparisons made to other companies may not be valid or come into effect.
Chris Vermeulen Archive |
© 2005-2019 http://www.MarketOracle.co.uk - The Market Oracle is a FREE Daily Financial Markets Analysis & Forecasting online publication.