Gold and Silver Now and Then - A Comparison / Commodities / Gold & Silver 2020

When making decisions regarding thegold mining stocks sector, some will choose to follow price actions whileothers will use indicator tools. The Gold Miners Bullish Percent Index ($BPGDM)is one such tool, essentially being a gauge of overbought and oversoldconditions for the gold mining sector with readings plotted on a range between0 and 100. Anything below 30 suggests oversold conditions while readings above70 indicate an overbought situation, with a buy or sell signal being triggeredwhen the index reaches an extreme level and then reverses. Because gold stocksmove in tune with gold or silver, the index can be useful in determining thedirection of the entire precious metals sector as well as acting like a crystalball when comparing historical patterns.
Most recently, the $BPGDM showed the highest possible overbought reading, which gives us an indicationthat the outlook for the precious metals is bearish.
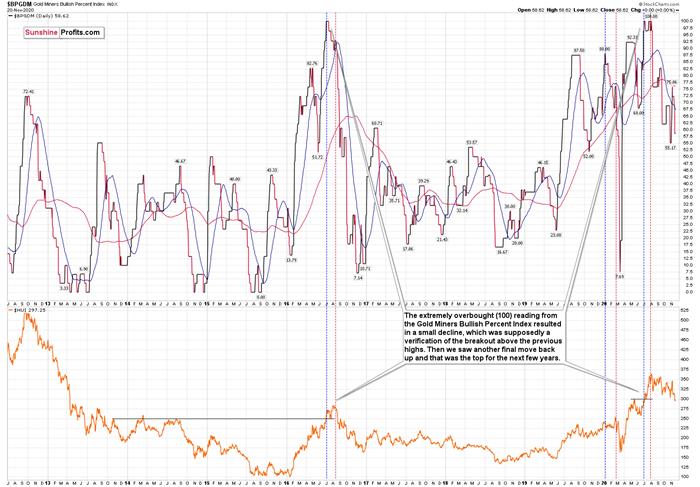
The excessive bullishness was present atthe 2016 top as well and it didn’t cause the situation to be any less bearishin reality. All markets periodically get ahead of themselves regardless of howbullish the long-term outlook really is. Then, they correct. If the upswing wassignificant, the correction is also quite often significant.
Please note that back in 2016, there wasan additional quick upswing before the slide and this additional upswing hadcaused the Gold Miners Bullish Percent Index to move up once again for a fewdays. It then declined once again. We saw something similar also this time. Inthis case, the move up took the index once again to the 100 level, while in2016 this wasn’t the case. But still, the similarity remains present.
Back in 2016, when we saw thisphenomenon, it was already after the top, and right before the big decline.Given the situation in the USD Index, it seems that we’re seeing the same thingalso this time.
Please note that back in 2016, after thetop, the buying opportunity didn’t present itself until the Gold Miners BullishPercent Index was below 10. Currently, it’s above 50, so it seems that miners have a long way to go before they bottom (perhapsa few months – in analogy to how gold declined in 2016).
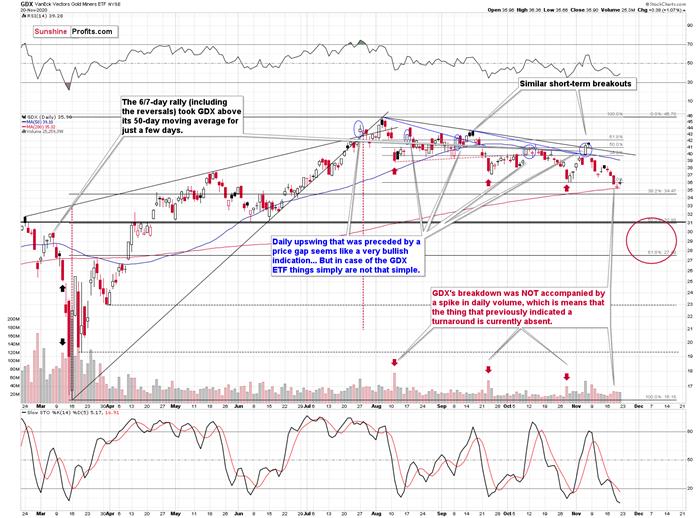
Lastweek , when I was preparing the analysis ofthe above GDX ETF chart, I commented on the late-week decline in the followingway:
On Thursday (Nov 12 th ) andFriday (Nov 13 th ) of last week, miners moved and closed higher,but it’s important to note that their upswing was tiny and not accompanied bystrong volume. In other words, it has all the characteristics of the breatherthat’s going to be followed by another move in the direction in which themarket had been moving previously.
The previous move was down, so theimplications are bearish.
The intraday nature of Friday’s andThursday’s moves is also quite informative. In both cases miners moved higher –just as gold did – but then they declined, erasing a large part of thepreceding gains before the end of the session. That’s yet another clueconfirming the counter-trend nature of the recent upswing in the miners.
Something similar took place last week,and thus today’s comments will be similar. Gold miners declined early duringthe initial part of the week, and then they bounced right before the weekend.The volume was decent, but nothing to call home about. What does it mean? Itmeans that we have just likely seen a regular breather that is likely to befollowed by further declines.
As indicated earlier, the biggest part ofthe decline might start shortly afterThanksgiving .
Also, let’s not forget that the GDX ETFhas recently invalidated the breakout above the 61.8% Fibonacci retracementbased on the 2011 – 2016 decline.
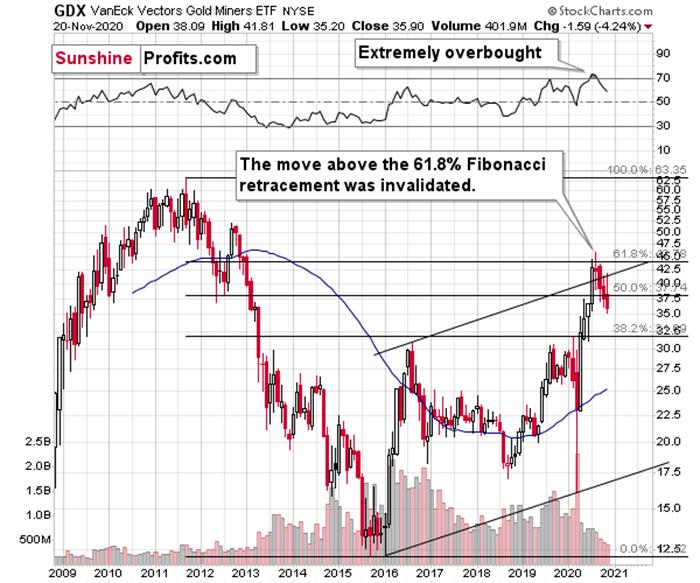
When GDX approached its 38.2% Fibonacciretracement, it declined sharply – it was right after the 2016 top. Are weseeing the 2020 top right now? This is quite possible – PMs are likely todecline after the sharp upswing, and since there is just more than one monthleft before the year ends, it might be the case that they move north of therecent highs only in 2021.
Either way, miners’ inability to moveabove the 61.8% Fibonacci retracement level and their invalidation of the tinybreakout is a bearish sign.
The same goes for miners’ inability tostay above the rising support line – the line that’s parallel to the line basedon the 2016 and 2020 lows.
Let’s proceed to metals themselves.
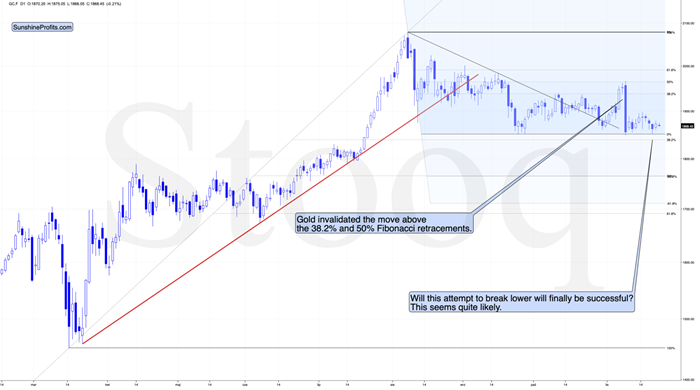
Just as miners , gold seems to be taking a breather. The breather was quite likely to occurafter such a big daily (Nov 9 th ) decline, and there’s not muchmore that we can say about it per se.
However, the size of the counter-trendrally is quite interesting when we compare it to the size of the correctiveupswing in silver.
Please note that gold is more or less inthe midway between the bottom and the 38.2% Fibonacci retracement based on theAugust – November decline.
Silver, on the other hand, was muchhigher in relative terms.
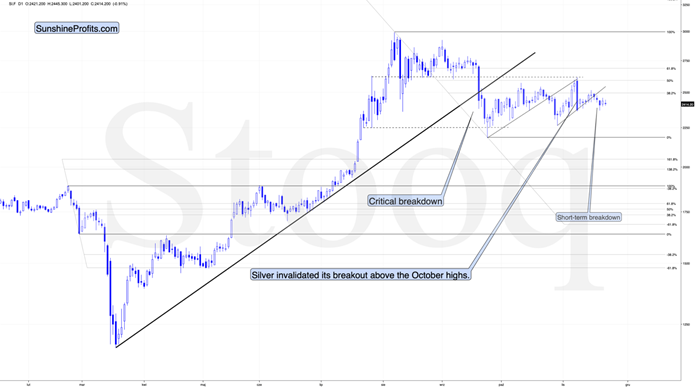
In fact, last Monday (Nov 16th), silvereven moved slightly above the 38.2% Fibonacci retracement.
What does it mean? It means that silverwas outperforming gold on a very short-term basis. This might not be excitingto those who are new to the precious metals market, but it should be veryexciting for those who have been following my analyses for some time. Silvertends to outperform gold on a short-term basis right beforedeclines. Consequently, the above serves as a bearish confirmation.
Silver broke below the rising short-termsupport line since that time, which suggests that the days of the counter-trendrally are numbered. Based on the analogy to other U.S. election years, it seemsthat we won’t have to wait for long.
Thank you for reading our free analysistoday. Please note that the following is just a small fraction of today’sall-encompassing Gold & Silver Trading Alert. The latter includes multiplepremium details such as the downsidetarget for gold that could be reached in the next few weeks.
If you’d like to read those premiumdetails, we have good news for you. As soon as you sign up for our free goldnewsletter, you’ll get a free 7-day no-obligation trial access to our premiumGold & Silver Trading Alerts. It’s really free – sign up today.
Thank you.
Przemyslaw Radomski, CFA
Founder, Editor-in-chief
Toolsfor Effective Gold & Silver Investments - SunshineProfits.com
Tools für EffektivesGold- und Silber-Investment - SunshineProfits.DE
* * * * *
About Sunshine Profits
SunshineProfits enables anyone to forecast market changes with a level of accuracy thatwas once only available to closed-door institutions. It provides free trialaccess to its best investment tools (including lists of best gold stocks and best silver stocks),proprietary gold & silver indicators, buy & sell signals, weekly newsletter, and more. Seeing is believing.
Disclaimer
All essays, research and information found aboverepresent analyses and opinions of Przemyslaw Radomski, CFA and SunshineProfits' associates only. As such, it may prove wrong and be a subject tochange without notice. Opinions and analyses were based on data available toauthors of respective essays at the time of writing. Although the informationprovided above is based on careful research and sources that are believed to beaccurate, Przemyslaw Radomski, CFA and his associates do not guarantee theaccuracy or thoroughness of the data or information reported. The opinionspublished above are neither an offer nor a recommendation to purchase or sell anysecurities. Mr. Radomski is not a Registered Securities Advisor. By readingPrzemyslaw Radomski's, CFA reports you fully agree that he will not be heldresponsible or liable for any decisions you make regarding any informationprovided in these reports. Investing, trading and speculation in any financialmarkets may involve high risk of loss. Przemyslaw Radomski, CFA, SunshineProfits' employees and affiliates as well as members of their families may havea short or long position in any securities, including those mentioned in any ofthe reports or essays, and may make additional purchases and/or sales of thosesecurities without notice.
Przemyslaw Radomski Archive |
© 2005-2019 http://www.MarketOracle.co.uk - The Market Oracle is a FREE Daily Financial Markets Analysis & Forecasting online publication.