Gold and Silver Shine as the Fed Cuts Rates: What's Next? / Commodities / Gold & Silver 2024
When the Federal Reserve decides to slash interest rates, it sets off a domino effect in the financial world, and precious metals like gold and silver are among the first to feel the impact. Yesterday, we saw a 0.50% cut, so it’s time to revisit how these metals have historically performed… and let’s just say, they’ve put on quite the show.
The Golden (and Silver) Truth About Fed Rate Cuts
Since 2000, gold and silver have shown a knack for appreciating when the Fed cuts rates by a full half percentage point. Here’s a look at how they’ve danced to the Fed’s tune:
Gold’s Performance
3 Months After a Cut: Gold struts to an average return of 3.3%.6 Months After a Cut: Gold kicks it up a notch with a solid 8.5% average return.Silver’s Performance
3 Months After a Cut: Silver steps in with a respectable 2.0% average return.6 Months After a Cut: This is where silver truly shines, posting an impressive 11.5% average return.Clearly, both metals have a tendency to sparkle post-rate cuts. While gold shows a steady and dependable uptick, silver tends to take a more dramatic leap, particularly over a six-month span.
The Gold-Silver Ratio: Closing the Gap
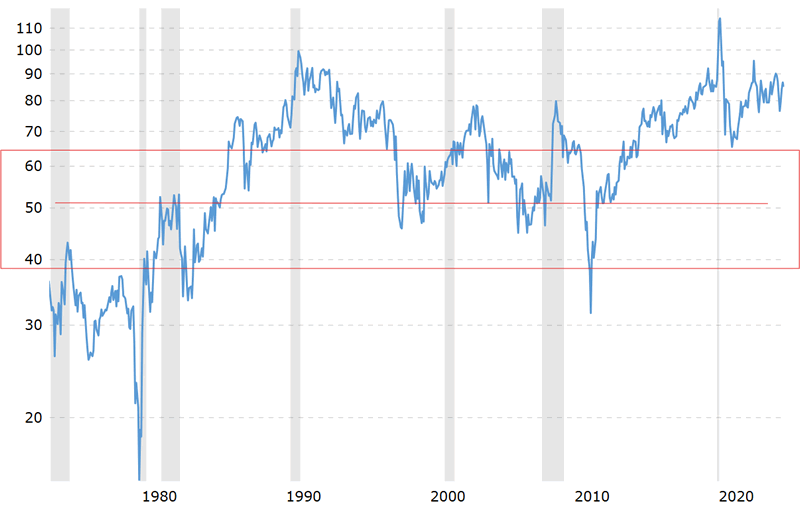
Now, here’s where it gets interesting. We at Neptune Global have been talking about this all year; the infamous gold-silver ratio. At the beginning of 2023, this ratio was sitting pretty at 90:1, meaning gold was a whopping 90 times more expensive than silver. Fast forward to now, and it’s tightened to about 83:1.
Why does this matter, you ask? Well, the gold-silver ratio is like the market’s way of telling us which metal might be undervalued. Historically, the 50-year happy median is arguably 50:1, which means there’s still quite a bit of room for silver to catch up. If silver closes in on this historical median while gold stays put, we’re looking at silver jumping up to $51.70, right around its nominal high.
Gold to Silver Ratio – 50 years
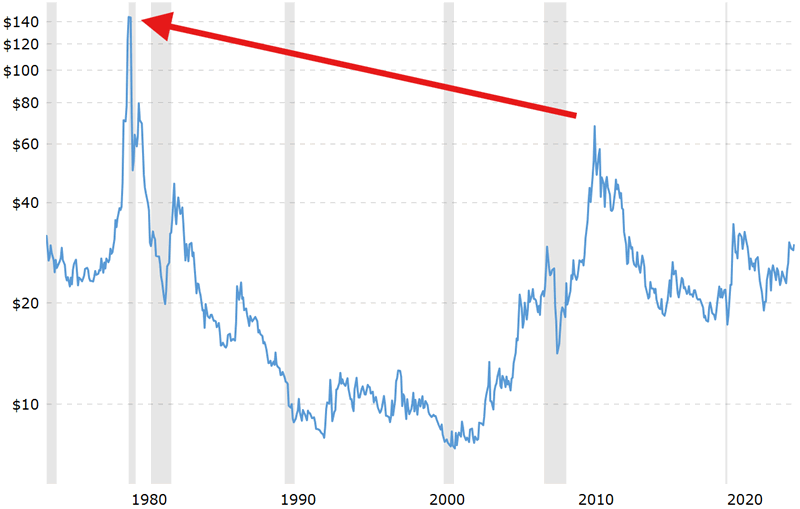
And if you want to get really excited (or maybe just a little bit greedy), consider this: the inflation-adjusted high for silver right now is a jaw-dropping $145. With rising debt and money printing going into overdrive, that target is getting pushed higher every day.
Silver Price Chart – Inflation Adjusted – 50 years
Why Park Your Money in Metals?
With the Fed sending the cost of money down the slide and savings accounts offering laughably low interest rates, where does an investor turn? Historically, precious metals have been the alternative safe haven. Gold and silver don’t just sit pretty in a vault; they preserve purchasing power and, more often than not, outperform those dismal interest rates.
So, why not give your cash a golden parachute? By moving some funds into precious metals, you’re not just hedging against inflation, you’re setting yourself up for a potentially lucrative ride.
The Bottom Line
History has shown us that gold and silver tend to flourish when the Fed cuts rates, and silver, in particular, often shines brighter over the long term. With the gold-silver ratio tightening, silver seems poised for a potential breakout. For those looking to preserve and potentially grow their wealth now again in a world of shrinking interest rates, it might be time to give gold and silver a closer look. After all, these metals have a way of glimmering when the financial skies get cloudy.
Brandon Green
Neptune Global, Director of Sales
© 2024 Copyright Kelsey Williams- All Rights Reserved Disclaimer: The above is a matter of opinion provided for general information purposes only and is not intended as investment advice. Information and analysis above are derived from sources and utilising methods believed to be reliable, but we cannot accept responsibility for any losses you may incur as a result of this analysis. Individuals should consult with their personal financial advisors.
© 2005-2022 http://www.MarketOracle.co.uk - The Market Oracle is a FREE Daily Financial Markets Analysis & Forecasting online publication.
