Gold And Silver Stocks Correction Almost Exhausted, Time To Buy / Commodities / Gold & Silver 2020

Introduction
Today, we will take a look at the damage inflicted on this sectorby the recent sell-off and try to ascertain just what lies ahead for theprecious metals stocks involved in gold and silver mining.
We will commence with look at the charts for gold and silverprices followed by a comparison of gold’s progress versus that of the Gold BugsIndex (HUI) and conclude with what lies in store for the Precious Metals stocksin the medium term.
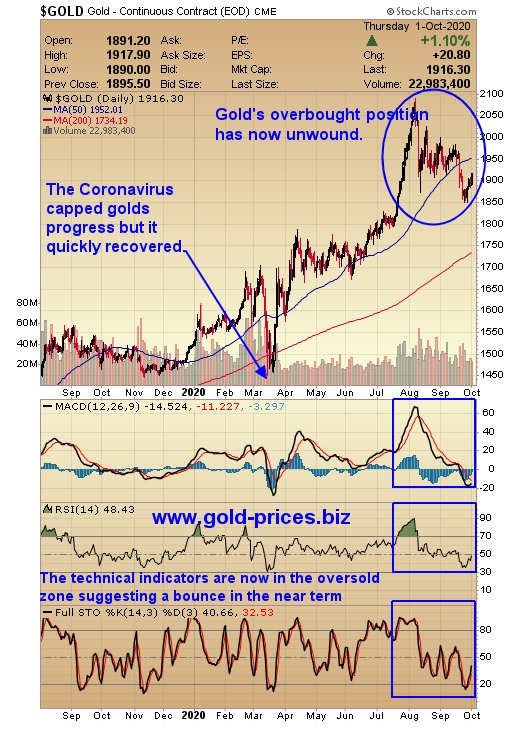
The 12-Month Gold Chart
The Coronavirus cappedgolds progress early this year however it recovered quickly to trade at higherlevels than before this nasty virus struck. The technical indicators, the RSI,MACD and the STO are now in the oversold zone suggesting a near term bounce ison the cards and that this correction has ran its course.
Those investors that rely purely on chart analysis they will seethis set up as an opportunity to acquire gold at a discount to what gold was afew months ago and venture back into this market sector with the view toacquiring a bargain.
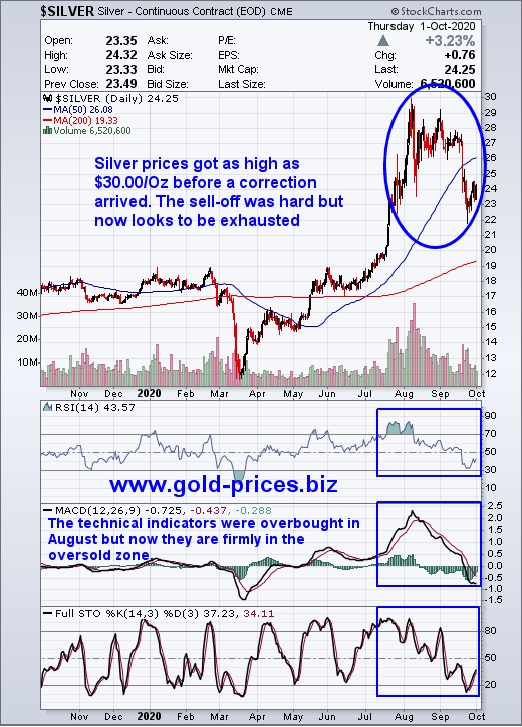
The 12-Month Silver Chart
The technical indicators were overbought in August however, as thechart below indicates they are now firmly in the oversold zone due to the priceof silver falling approximately $5.00/Oz in a few short months.
Silver is now positioned below its 50dma and above its 200dmawhich suggests that there is plenty of room to move higher.
It should also be noted that both of these moving averages areheading north which I view as a positive indicator as they suggest that thereis support for silver goingforward.
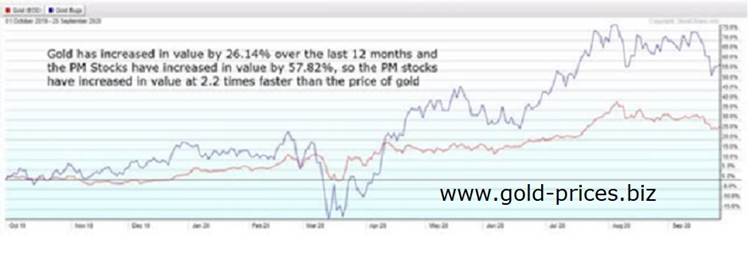
A Comparison Chart Of Gold And The PreciousMetals Stocks
What we can glean from the chart below is that gold has increasedin value by 26.14% over the last 12 months and the PM Stocks have increased invalue by 57.82%, so the PM stocks have increased at a speed which is 2.2 timesfaster than the price of gold
The Gold Bugs Index: The HUI
The chart below shows that the HUI may have found a base at 320,however, these are volatile times and wild fluctuations are to be expected. Thetechnical indicators on the chart below are now a tad oversold so we could geta bounce from this point.
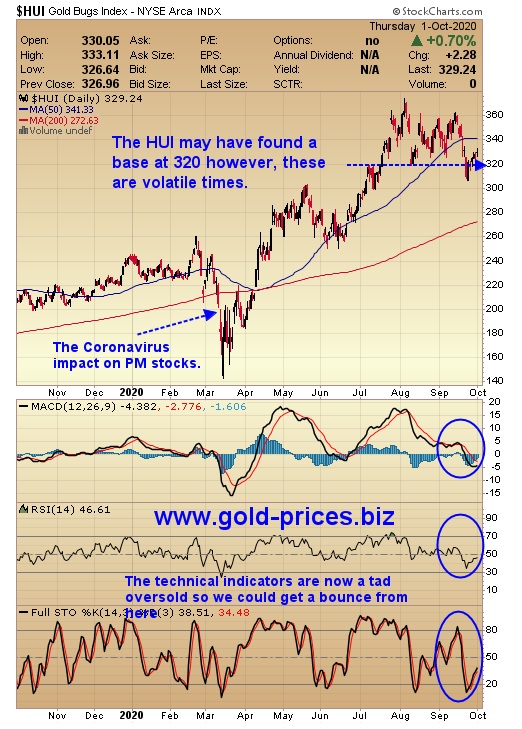
It should also be noted that that Q2 has just ended whichcoincides with the Quarterly Options trades expiring on 30th September 2020.The price of gold can be volatile in the lead-up to this expiry date as traderstry to position themselves to generate a profit from such price oscillations.
Conclusion
A visual inspection of the above charts suggest that the PM stockshave not suffered as badly as they could have done, which is a sign of theirunderlying strength.
Gold and silver have been sold-off hard in a correction that waswarranted. However, they are both now positioned to consolidate and form a newbase in preparation of a resumption of this Bull Market.
Central Banks continue to print money at an unprecedented speed inturn they are diluting the value of their currencies and so investors willrotate out of currencies and into a form of hard assets. My preferred hardasset is gold; however, some investors prefer Land and Property as analternative investment, a subject I will leave for better informed writers thanmyself, but nevertheless worthy of your consideration.
In Q3 gold was on average about $190/Oz more expensive that it wasin Q2 so this next round of financial results should be sparkling and give thePM stocks a real boost.
During this dip I did managed to acquire one stock that has beenon my Watch List for some time and I am actively searching for the next bargainto add to my portfolio of PM stocks.
For the record, I am long physical gold and silver and own around19 open positions in this sector, including Wheaton Precious Metals Corp. (WPM) SSR Mining Inc. (SSRM), Kirkland LakeGold Ltd. (KL) and Sandstorm Gold Ltd. (SAND).
I am of course biased towards this sector of the market so pleasedo your own due diligence.
Take care.
BobKirtley
Email:bob@gold-prices.biz
www.gold-prices.biz
URL: www.skoptionstrading.com
DISCLAIMER : Gold Prices makes no guarantee or warranty on the accuracy or completeness of the data provided on this site. Nothing contained herein is intended or shall be deemed to be investment advice, implied or otherwise. This website represents our views and nothing more than that. Always consult your registered advisor to assist you with your investments. We accept no liability for any loss arising from the use of the data contained on this website. We may or may not hold a position in these securities at any given time and reserve the right to buy and sell as we think fit.
Bob Kirtley Archive |
© 2005-2019 http://www.MarketOracle.co.uk - The Market Oracle is a FREE Daily Financial Markets Analysis & Forecasting online publication.